


Starting a small business is hard—and tracking its progress can sometimes feel even harder.
You want to accept payments from customers, report everything, and accurately track all your financial metrics to manage your growth while preventing waste.
But with so many finance and accounting terms being thrown around, it’s easy to feel like you’re losing the forest for the trees.
Below, we cover eight key performance indicators every small business needs to understand and track to measure their financial performance.
Net Income
A business can earn millions in gross recurring revenue, but if its expenses are higher, the business is still far from profitable.
Keep in mind that, while the terms may often seem interchangeable, net income is not the same as revenue.
Here’s the difference in a nutshell:
- Revenue (or sales revenue) is the total sum of money generated from doing business
- Net income is the money left over after tax and other business expenses
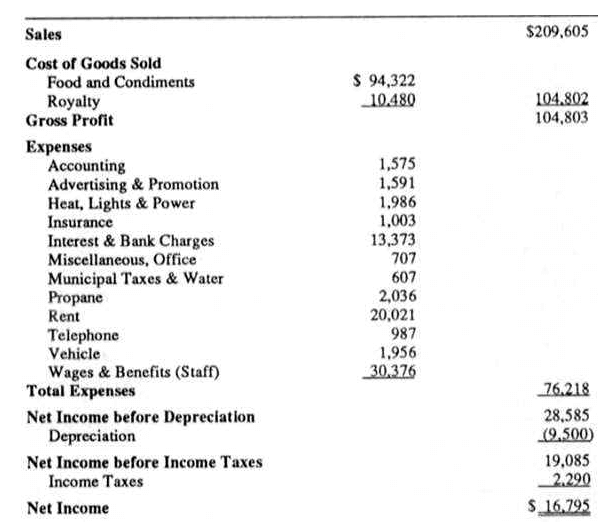
Say you run a restaurant. Here’s what your income statement might look like for a given month:

Source: Bookkeeping Chef
Your total gross sales for the month were $209,605—which sounds impressive. But it wouldn’t be smart to use that number with how much income you really made.
First, you need to see if you broke even with your expenses—and how much profit you have left over to show for it.
As you can see, there are quite a few expenses involved in running a restaurant, and each of these is deducted from your gross revenue to get your net income.
Things like the cost of goods sold, advertising, rent, and taxes must be accounted for before you see how much you have left to use.
By the time you cover the costs of doing business, you have $16,795 left in net income. This is the true income for your business, and this number tells you how profitable you truly are.
Profit Margin Ratio
When tracking your profit for a given period, it’s important to understand the difference between gross margin and net margin. While both terms refer to profitability ratios, they are very different.
Gross margin is the percentage of money left over after deducting the cost of goods sold (COGS) from the total revenue.
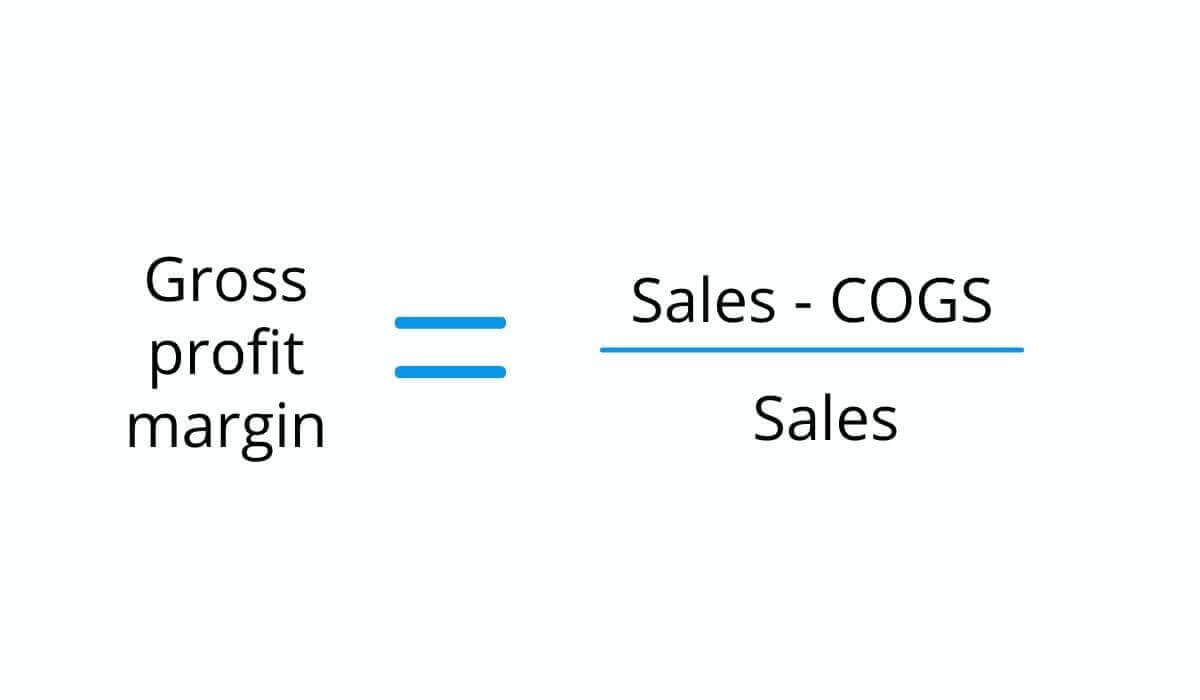

Source: Regpack
In our example above, gross profit is calculated by taking the total revenue ($209,605) and subtracting the COGS ($104,802) to get $104,803.
This number, expressed as a percentage of the total revenue represents the gross profit margin. In this case, it is 50%.
But you can see from the income statement above that the calculations are far from over once you get the gross profit margin. There are still quite a few costs to account for, including other operating expenses, interest, and taxes.
If net income is calculated by first subtracting all expenses on the balance sheet from the total sales, the net profit margin is the percentage of net income compared to the total sales.
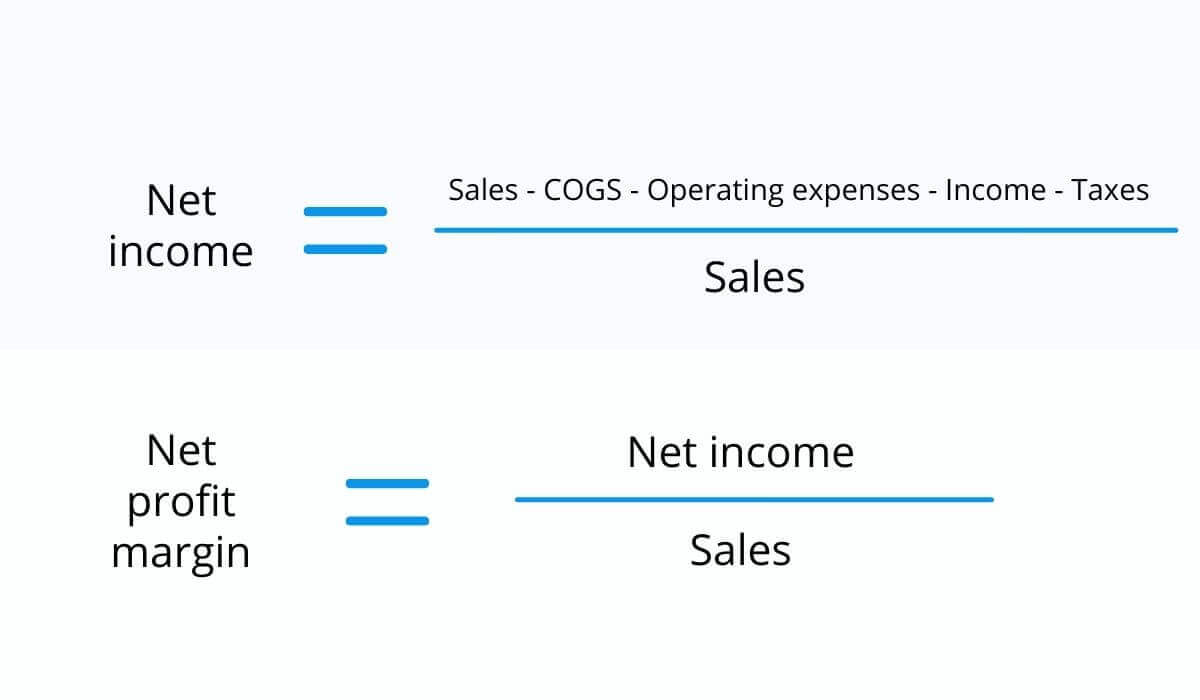

Source: Regpack
Both of these are important financial KPIs to track because they show you how well your company is performing.
Expenses
They may say that you have to spend money to make money—but how much is too much?
The best way to think about your expenses is to measure them as a percentage of revenue. The optimal average expense percentage varies by industry, service, or product type.
Speaking extremely generally, it may be optimal for your business to keep costs and taxes within 80-95% of your gross revenue. However, benchmarks vary widely by industry and other factors.
Industry averages for each sector below indicate the average benchmarks for net profit margin and gross profit margin.
As a quick reminder of definitions:
- Gross profit margin is revenue minus the cost of goods sold
- Net profit margin refers to revenue minus ALL expenses, including COGS, operating expenses, interest, and taxes
As you can see in the chart below, if you run a restaurant, your benchmark for pre-tax profit is 67%. So, you should aim to spend 33% or less of your revenue on the cost of goods sold.
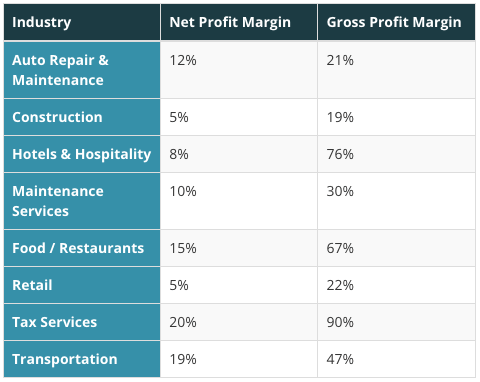

Source: Camino Financial
If your expenses make up a higher percentage of revenue, it may be time to adjust your operations and expenditures.
Cash Flow
As the name implies, cash flow is the movement of money both in and out of a company. Money that comes in is known as an “inflow”, while the money that’s spent is called an “outflow.”
Ben Richmond, a chartered accountant and U.S. money manager at Xero, explains cash flow as the fuel that keeps the company running:
“If you’ve got no gas, the Ferrari is nothing but an ornament sitting in the garage.”
In financial statements, a cash flow statement like the one below reports the company’s sources of cash and how it was used over the period.
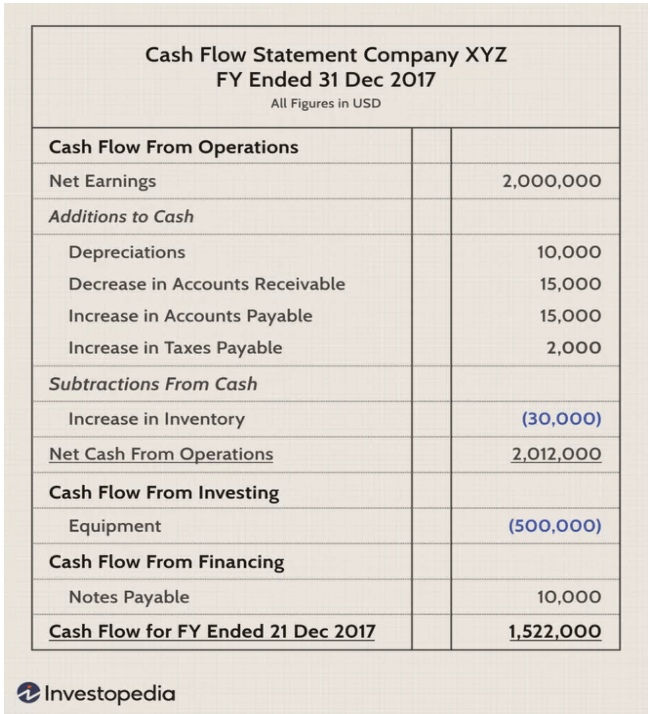

Source: Investopedia
There are three types of cash flow, based on the money’s source:
- Operating cash flow
- Cash flow from investing
- Cash flow from financing
Let’s take a closer look at each type below.
Operating Cash Flow
Operating cash flow (OCF) is the cash flow from operating activities. It’s usually the first section of a cash flow statement.
Whether your company sells a product or provides a service, your OCF is the cash that flows in and out from doing everyday business activities like:
- Selling products and/or services
- Buying inventory and paying suppliers
- Writing paychecks
- Paying taxes
- Making rent and utility payments
Essentially, OCF is the amount of income received from the business doing day-to-day operations.
Cash Flow From Investing Activities
Cash flow from investing activities (CFI) is the cash flowing in and out due to investment, like:
- Knowing how to invest in stocks and bonds
- Buying long-term assets
- Selling assets or securities
- Capital expenditures
The CFI metric is used to analyze whether the company is set up for long-term growth. Even if a business is generating negative investing cash flow by purchasing assets, these investments could lead to greater cash flow in the long term.
Looking at the company’s investment activities as a whole can help analysts and investors understand the company’s financial health and make data-driven decisions about their long-term goals.
Cash Flow from Financing
The last type of cash flow is the money generated or spent on financing activities. These activities might include:
- Generating cash through bond offerings
- Paying dividends to shareholders
- Stock buybacks
- Paying down debt
- Taking on loans from a bank or creditor
Cash flow from financing (CFF) measures the movement of cash between the company’s investors, creditors, and owners. It deals with the debt and equity of the company, as well as the dividends paid to investors.
Companies need to raise cash to see business growth. Whether it’s through issuing bonds, selling stock, or taking on loans, these activities can be seen in the CFF section of the cash flow statement.
Accounts Receivable/Payable
In a perfect world, customers would always pay promptly and in full. But as every small business owner knows, we don’t live in that perfect world.
Companies must have a process for tracking due and overdue payments from customers. They must similarly track the payments they make to vendors, suppliers, and any other party they owe money.
Accounting practices typically categorize these payments in various stages of “aging.”
An accounts aging report organizes customers’ outstanding balances in order of how long the invoices have been overdue. Most accounting and payments software options, such as Regpack, generate reports that let you track overdue payments from customers.
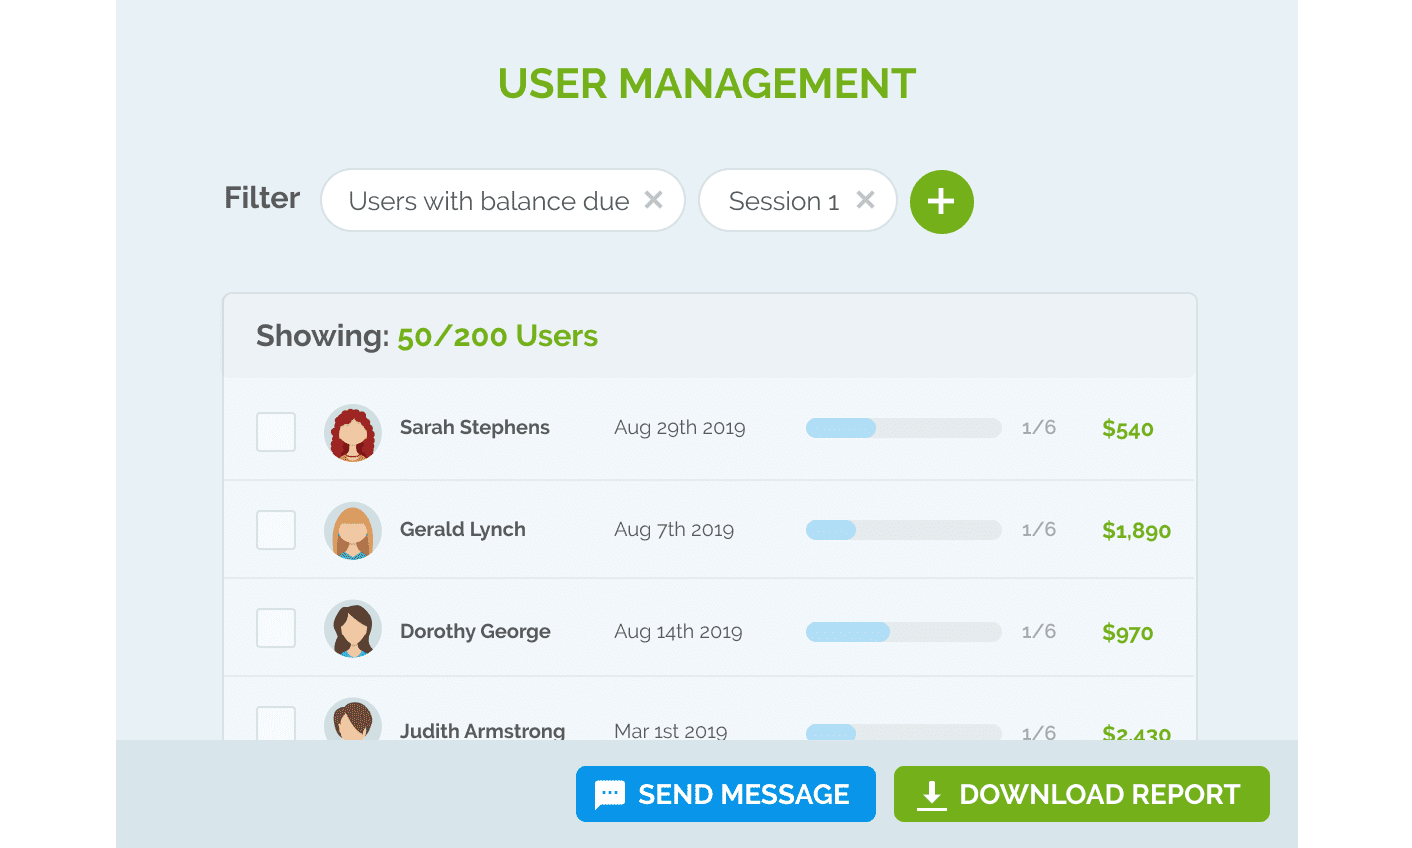

Source: Regpack
Income in theory is one thing, but until those funds have landed in your bank account, you haven’t really made any money—which is why accounts receivable is an important metric for businesses to track.
You have to know which invoices are still outstanding if you want to follow up on late payments, charge late fees, and hunt down every cent you’re owed.
And similarly, it’s crucial to track your accounts payable (the funds you owe to others).
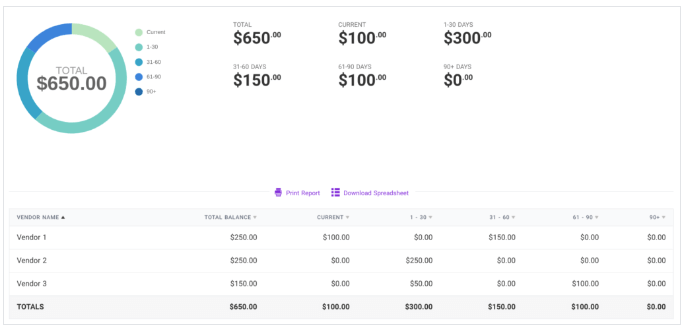

Source: Patriot
An accounts payable (A/P) aging report shows you the invoices that are upcoming, due, and overdue so that you can manage your cash flows and not be caught unawares by a late fee.
Quick Ratio
A quick ratio is a useful metric that investors use to determine a company’s financial strength.
Essentially, the quick ratio answers the question of how quickly the company could pay off its debts. If the business’s quick assets (or assets that could easily be converted into cash) are far outweighed by the company’s debts, it may not be a wise investment.
The quick ratio is a lot like its name suggests: a quick calculation. It may not be very nuanced, but it’s an easy way to get a broad idea of the financial health of a company.
To determine a company’s quick ratio, simply divide the sum of its highly liquid assets by the sum of the company’s current liabilities.
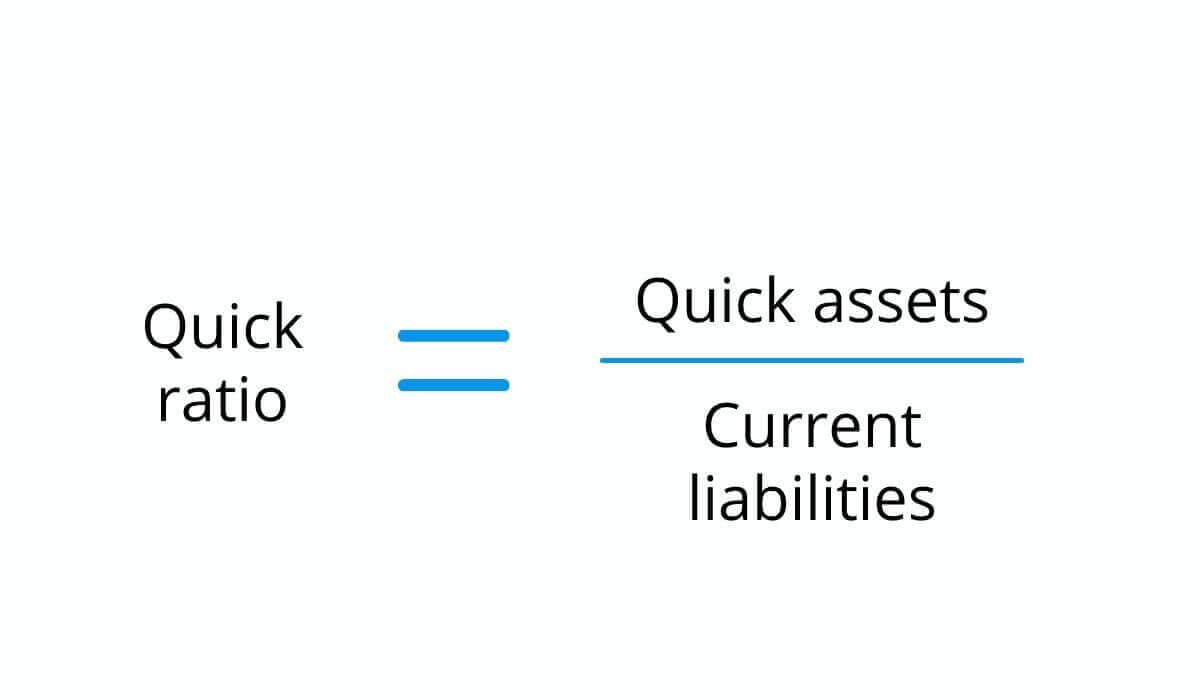

Source: Regpack
Quick assets are anything that might be converted into cash within 90 days, such as:
- Cash and cash equivalents
- Securities that can be sold quickly
- Current accounts receivable
- Any other assets or inventory that can be sold (at their actual value) within 90 days
Notice that you don’t have to include all liabilities in the quick ratio equation—only current ones. Current liabilities are only debts that must be paid within a year, such as:
- Dividends
- Salaries and wages
- Short-term loans
- Accounts payable
- Current payments of long-term loans
- Income taxes
- Payroll taxes
So, what makes a good quick ratio? If the current ratio is at 1 or more, it has enough liquid assets to pay its current liabilities—which is a positive indicator of the company’s current financial health.
Average Customer Acquisition Cost
Customer acquisition cost (CAC) is the measurement of how much it costs (in terms of sales and marketing efforts) to earn a new customer over a specified window of time.
Customer acquisition cost is calculated by dividing total sales and marketing costs by the number of new customers acquired over that time period.
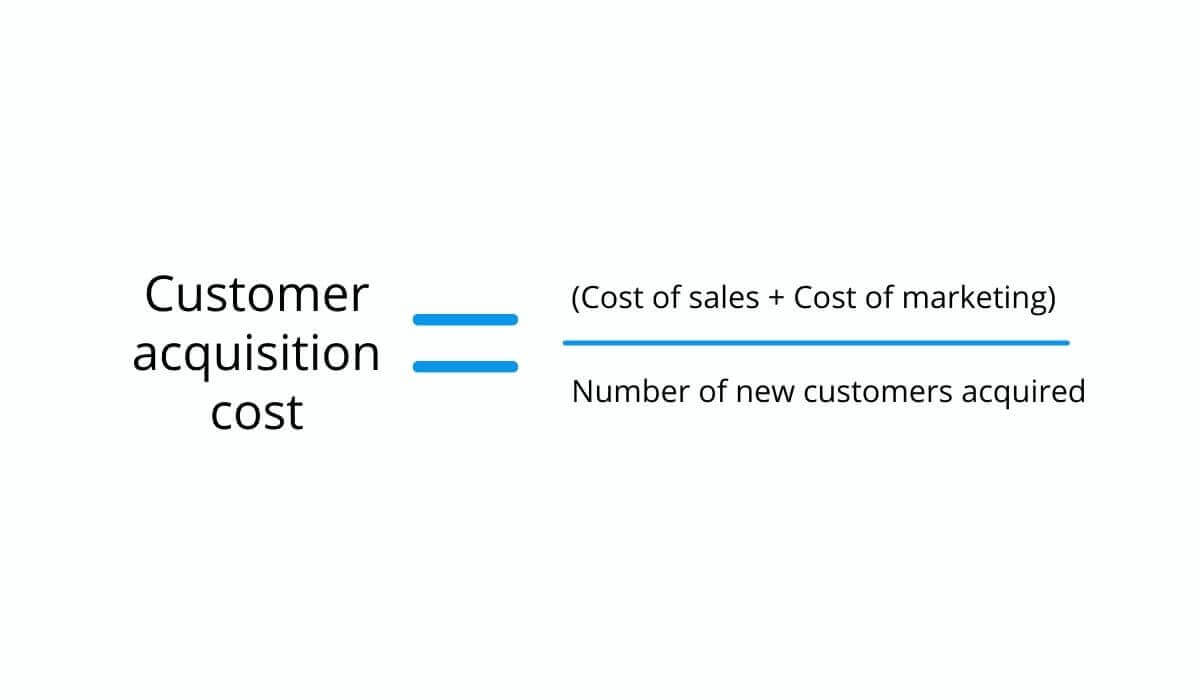

Source: Regpack
As you can imagine, the average customer acquisition cost varies greatly by industry. For example, the average cost to gain a new lead in the B2B financial services industry is around $160—while the cost in the B2B retail industry is just $34.
The average CAC metric is useful to businesses in determining how much money is needed to expand their customer base without sacrificing profit. Once you know your average customer acquisition cost, you can set goals to decrease that cost over time.
As David Brim of Bright Impact explains:
“Acquiring profitable customers is an essential part of any business’s strategic goals. Business owners should regularly work to understand the average cost of acquiring a certain type of customer relative to the lifetime value of that customer. Then work to reduce customer acquisition costs by improving marketing strategy while determining ways to retain or upsell existing customers to increase customer value.”
After all, the less it costs you to earn new business, the wider your profit margin.
Churn Rate
Finally, businesses must track their churn rate or the rate at which they lose customers.
User churn is the number of customers who stop using your product or buying your service, and generally end their business relationship with your brand.
While it may seem like the solution is to simply acquire new customers, remember from the previous section that it costs money to find new buyers.
It’s much more profitable to maintain current customer satisfaction than to continually find new customers.
As Sophia Bernazzani writes for HubSpot:
“While there’s a certain allure that comes with capturing new customers, keeping customers coming back will continually result in a greater ROI—and it costs 5-25X less.”
A high churn rate negatively affects the other metrics on this list. Without a strong and happy customer base, it can be difficult to see consistent growth and profits from quarter to quarter.
So how do you know when your churn rate is getting too high?
First, calculate your churn rate by dividing the number of customers who have churned by the total number of customers you have for a specific period of time.
Do this calculation regularly, and you’ll have your company’s average churn rate that you can compare to the average rates in your industry.
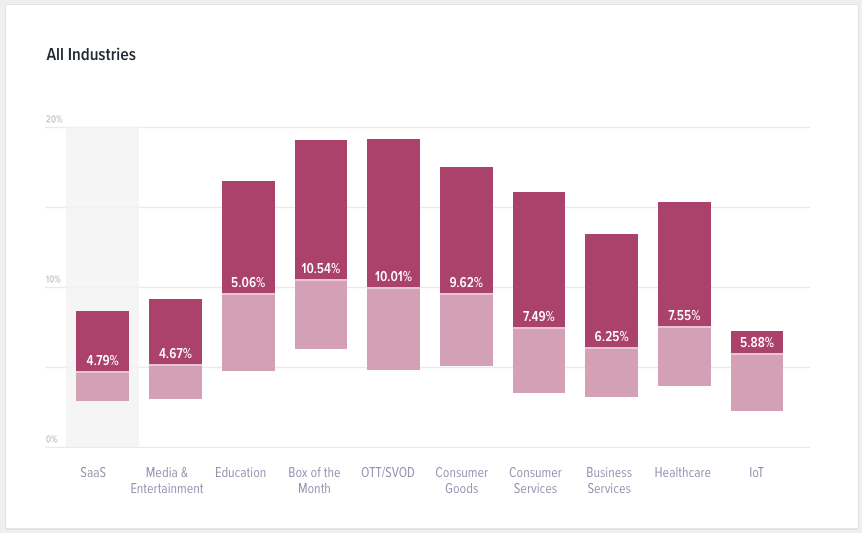

Source: Recurly
If your churn rate is higher than the industry average, it’s time to start focusing on customer retention. You can find some useful tips on how to convince your customers to keep doing business with you here.
These Small Business Finance Metrics Can Make a Difference
The complex nature of spending money to make money, including taking on loans, offering discounts, chasing down overdue invoices, and keeping the office lights on, can make it extremely difficult to figure out whether you’re breaking even.
That’s why tracking these eight metrics can provide valuable insights into your business’s financial health and help you make attainable business goals.
Make sure you’re using accounting and payment processing tools that provide the detailed data you need to monitor your key finance metrics.
Regpack’s advanced analytics features give you in-depth reports on payments, overdue invoices, sales, customer data, and more. Take charge of your company’s financial health and operational efficiency with a free demo of Regpack today.