
This video shows how to use Regpack’s statistics tool to visually analyze your registration software. This easy to use and powerful reporting tool will allow you to gain new insights in your business data.
Click the cc button to turn captions on and off. There’s also a complete transcript of the video below, including a few additional product configuration tips. Check out our YouTube channel for more videos on how to get the most out of Regpack’s easy to use registration management system.
Statistics for Online Registration Software Video Transcript
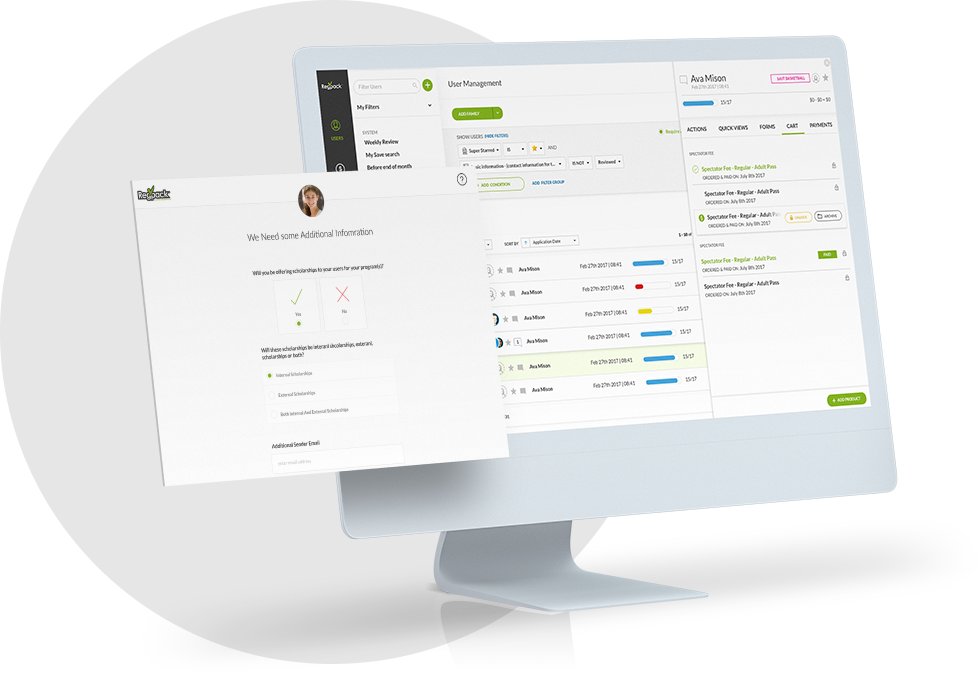
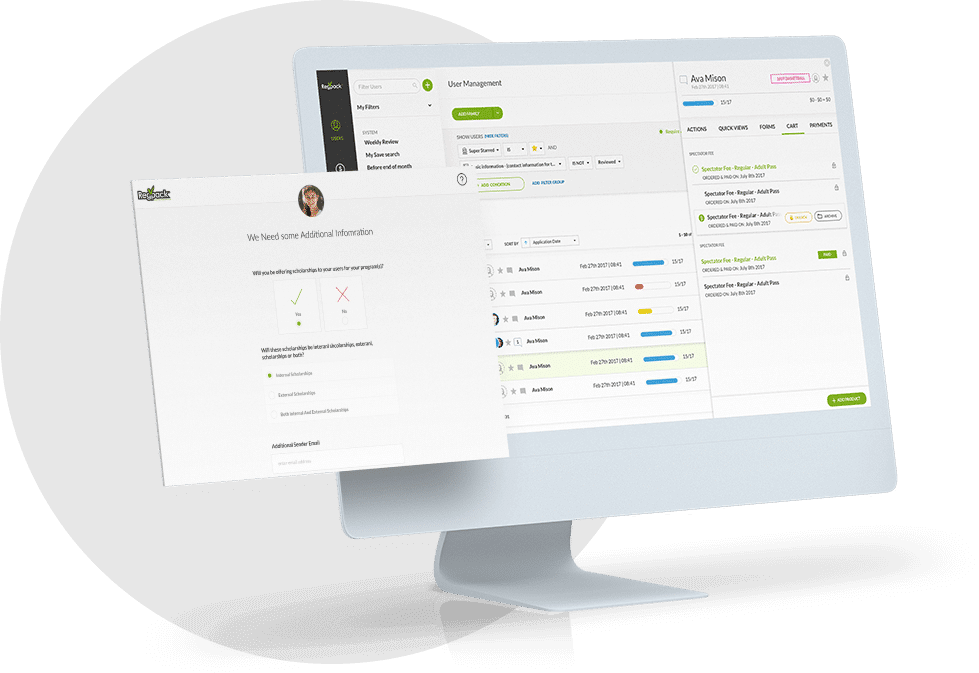
Welcome to Regpack. In this video we’ll show you how to view statistics about your project. Statistics are available when you run a report from the Actions menu.
To view statistics, click the icon to the right of the report name. You can use the Report View button to see the actual report data. Statistics are graphical view of your report. Click the Statistics View button to go back to the graphs.
Just like reports, you can view statistics for all of you users or use Filters to view statistics for a specific group of users. In this example example we’re looking at city data that’s been filtered to only show applicants who’ve been accepted into the program.
When you run a report Regpack automatically generates statistics based on your data. There are three types of graphs available in statistics: pie charts, bar charts, and date graphs. This pie chart shows the percentage of male and female applicants. You can hover over the graphic to get an exact number. Click the Bars button to switch to the bar chart view. And the Pie button to switch back to the pie chart.
To switch between types of data within your report you can use the icons on the bottom of the page or the arrows on the left and the right. For date graphs, Regpack analyzes your data and allows you to switch between monthly and annually. Weekly may also be an option depending on the date ranges in your report.
Statistics are a great tool for analyzing data about your program. This example of registration dates gives you information on when to expect the biggest number of applicants and also gives you feedback on the effectiveness of your marketing, you can also use a marketing report automation platform like an agency analytics alternative.
The statistics information can be downloaded in three file formats: Adobe PDF, PNG image format, and SVG which is a vector format for graphics programs.
To see statistics on another report use the Select a Different Report button on the top left. This report shows the user status and also includes the application date. Using the Combine button we can show two kinds of report information all on one graph. Clicking on the Stacked button changes the way the graph is displayed. You can add and remove data points from the graph by clicking on the labels underneath.
This combined report shows when applicants applied and who was accepted. The Combine feature is a great tool for giving further insights about your project. Use the Save Combined Graph button on the top right to save this view of your data. The next time you view statistics for this report the combined graph will automatically be displayed.
We hope the statistics tool becomes a powerful way for you to analyze and share information about your project. If you have questions you can contact your account manager. And, as always, thanks for watching!