

Understanding the importance of great user SaaS onboarding is what separates top companies from the rest.
Making improvements to the onboarding process is one of the best ways to boost your software’s value.
However, the improvement decisions you make have to be data-informed; otherwise, you’re just guessing what works.
In this guide, we’ll tell you all you need to know about tracking and improving top user onboarding metrics for your SaaS.
Jump to Section
Why Onboarding Metrics Matter
Which User Onboarding Metrics to Track
Why Onboarding Metrics Matter
Your users will determine how much value they get out of your software in part depending on the quality of the onboarding.
Tracking the right onboarding metrics becomes a critically important task for the future of their relationship with your SaaS.
When you know which metrics to monitor, you can understand if your users know enough about your software to get the most out of it.
If you’re looking at the wrong metrics, you can never be sure your new clients even completed the onboarding process.
Worst of all, you’ll fail to make improvements where it matters.

Tracking the right onboarding metrics allows you to fix the leaks in your onboarding process.
You want new users to have the best onboarding experience, so leaving things to chance is out of the question.
Whether your onboarding becomes efficient is entirely up to you.
If this task feels overwhelming, we’re here to clear the air and help you understand which metrics you should focus on.
For starters, there are three different metric types you should know:
- User metrics that show how many users begin the onboarding process and how many finish it.
- Session metrics reveal how often an individual user logs in and how long their session lasts.
- Event metrics tell you what actions users made during their onboarding sessions.
Congrats! Now you understand the importance of tracking onboarding metrics and the three fundamental types.
Now let’s take it one step further.
Which User Onboarding Metrics to Track
Since working with dozens of new metrics is no easy task, we’re going to explain which user onboarding metrics you should focus on.
After reading this, you’ll have a better understanding of what metrics work best for your business.
Number of Users Onboarding
Tracking the number of SaaS users going through the onboarding process stands as the first metric you should follow.
After all, it’s a good idea to do a user headcount first before considering other areas of improvement.
So, first things first, know how many users are going through your onboarding process.
From the moment they sign up for your SaaS and log in for the first time, they enter the onboarding funnel.
Tracking their exact number gives you a quantitative piece of data that can be monitored and worked with.
The number of users in the onboarding process tells you how well your company is doing in acquiring new clients for your software.
If any new users are entering the onboarding funnel, you’re doing something right to attract them. In case it’s the opposite, adapt your user acquisition strategy.
Here’s a straightforward way to track the number of users’ onboarding.
Let’s say it takes 14 days for a user to learn how to use your software.
Then you should measure this metric as the number of clients that have signed in for your SaaS in the last 14 days.
After the initial 14 days have passed, you can say the onboarding window for new users has closed.
Told you it was simple!
Now, onto the second metric.
Time to Complete Onboarding
As you can tell, not every user will complete the onboarding at the same time, so it’s of utmost importance that you track the time to complete onboarding.
You’re right if you think a great onboarding experience should be short and effective.
After all, users want to engage with the SaaS they signed up for ASAP and spend as little time learning how to use it. Getting them there is your responsibility.
To make the learning curve as short as possible, the first step is to track how long an average user takes to complete the onboarding.
After that, we can talk about improvements.
To make completion time shorter, you must know how to make your onboarding as effective as possible.
Measuring the time to complete onboarding is simple maths.
For example, let’s say your 50 users took 146 hours to complete the onboarding.
302 (hours) / 50 (users) = 6.02 hours (or 6 hours and 12 minutes per user)
From there, look into each separate phase and see how to improve it.
The next metric we’ll discuss is all about the user’s progression through the onboarding funnel.
Customer Progression
Customer progression refers to the time it takes for a user to complete each phase of the onboarding process. It’s like putting the completion time under a microscope.
Understand that your onboarding process consists of different phases that a new user has to go through to completion.
Implementing solutions for each phase is essential to fine-tuning your user’s onboarding experience and making it as short as possible.
Monitoring customer progression starts with understanding what the milestones of your onboarding process are.
Onboarding consists of certain key steps or milestones that have to be completed to fully understand your software, just like any other process.
Every milestone has a different purpose that contributes to the overall success of the onboarding.
Some steps are always easier to complete than others, which is why it’s important to inspect every one of them.
Measuring specific milestone completion time is one of the most important ways of understanding what’s hindering the onboarding process.
It’s all right if some milestones take longer than others, but there’s always room for improvement.
This approach allows you to spot the effective patterns between well-crafted milestones and apply them to steps that take unusually long to complete.
If you’re through with leaving customer progression to chance, we’re on your side.
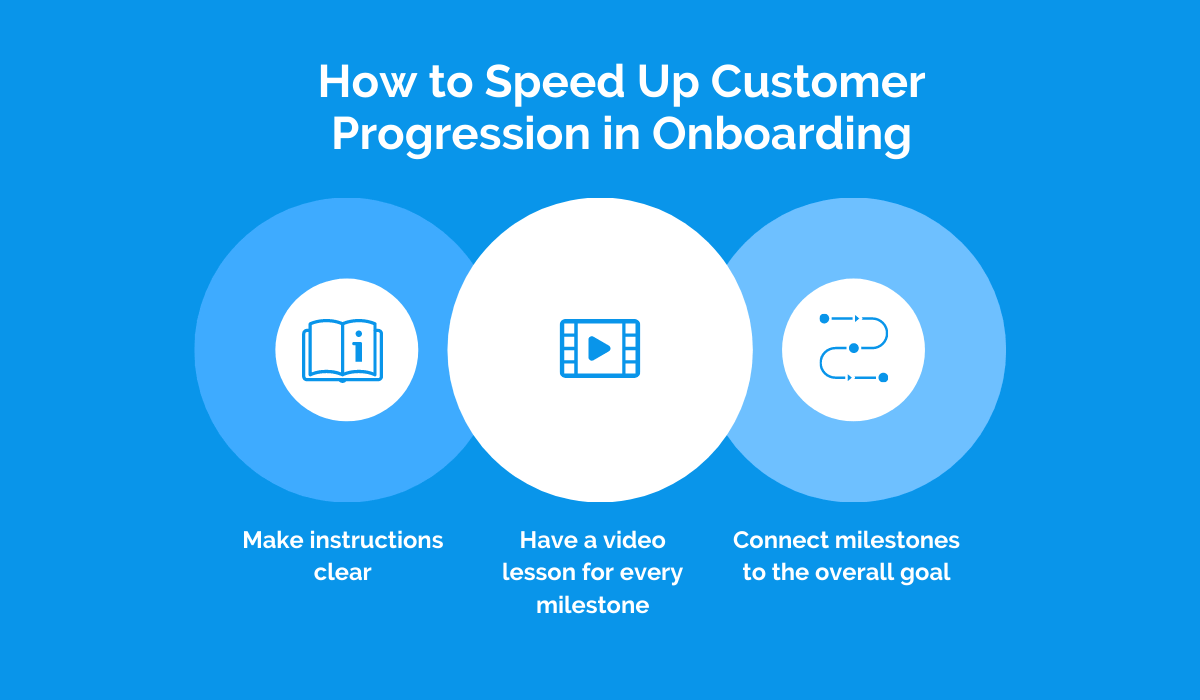
Here are our top tips for speeding up the time to complete each onboarding phase and make reaching milestones easy.
- Make your instructions clear and to the point
- Have a step-by-step video lesson available for every milestone
- Help the user understand the importance of every milestone and how completing it ties to the overall goal
Apply these changes to your milestones and note the improved customer progression time.
Customer progression is a continuous process and requires constant monitoring, so keep your eye on this metric at all times.
Session Metrics
After talking about customer progression, it’s time we get into the nitty-gritty of the session metrics.
For the session metrics, the first thing you should look at is the number of sessions per user.
The number of sessions a user has to have to go through the onboarding tells you a lot about their learning dynamics.
If they have to log in many times to complete the process, their onboarding experience is fragmented and potentially too long.
Ideally, your users should complete the onboarding in as few sessions as possible, depending on the complexity of your SaaS.
As you’re about to understand, the number of sessions is closely related to the session duration.
Session duration is the average time a user spends in a session. The shorter the session duration, the less engaged the user is.
You want to make their sessions longer to engage in the onboarding fully and complete the process sooner.
Have you ever struggled with a SaaS onboarding process so much that you had to log in and out ten times over before completing it?
You don’t want others to feel that way about your software.
For example, if you notice an individual user login in many times and go on the same page repeatedly, it can mean he’s struggling with a specific problem that you should fix.
Improving it will reduce the number of times he has to log in to do what he came for.
To supercharge your onboarding, you must track your session metrics to understand how many sessions a user has and how long they last.
Currently Active Users
The users that are actively using your solution are the lifeblood of your SaaS. It makes sense then that you should track currently active users as top onboarding metrics.
The number of currently active users reflects on the onboarding process of your SaaS.
If your active users count is dropping, it means something is drastically wrong, and you have to take action.
Tracking their number is a must-do preventive measure allowing you to stay on top of the situation.
Did you know there’s a name for this metric?
Top-performing SaaS companies use the DAU/MAU ratio to understand the percentage of currently active software users.
MAU stands for Monthly Active Users and is the number of unique users that log in at least once in 30 days.
DAU (Daily Active Users) tracks the number of users that log in to your SaaS at least twice per day.
Calculating the DAU/MAU ratio takes little effort but plays an important part in monitoring your user onboarding.
You can calculate it by dividing your DAU with MAU and multiplying by 100 to get a percentage of users that stayed active at the end of the month after the onboarding.
For example, if your SaaS has 100 000 active users and 300 000 active monthly users, your DAU/MAU ratio is:
100 000/300 000 * 100 = 0.33*100 = 33% (i.e. 33% of users have continued using your SaaS)
While you should use DAU to track the daily health of your SaaS in terms of user activity, tracking MAU is essential because it allows you to identify a negative trend that your onboarding can stop.
User Response/Experience
Every cat on the block knows that user experience is one of the most critical metrics for any business in any given industry. This is doubly true for the onboarding process.
If the process feels like a struggle or is less than user-friendly, you can bet your users will drop it in a heartbeat.
To ensure your user experience is top-notch, understand what your users expect from the process and figure out ways to improve it. Like it or not, you need their participation for this one.
This is where customer response comes into play.
You should collect responses from your users to make informed decisions on how to improve the user experience.
Your users can directly tell you what part of the onboarding needs attention so that new users can have a better experience.
All you have to do is give your users ways to voice ideas.
If you’re scratching your head right now, it’s time for us to step in.
You should actively use surveying methods to collect feedback from users.
Those methods include:
- Providing quick surveys to users
- Giving them short questionnaires after completing a certain number of milestones
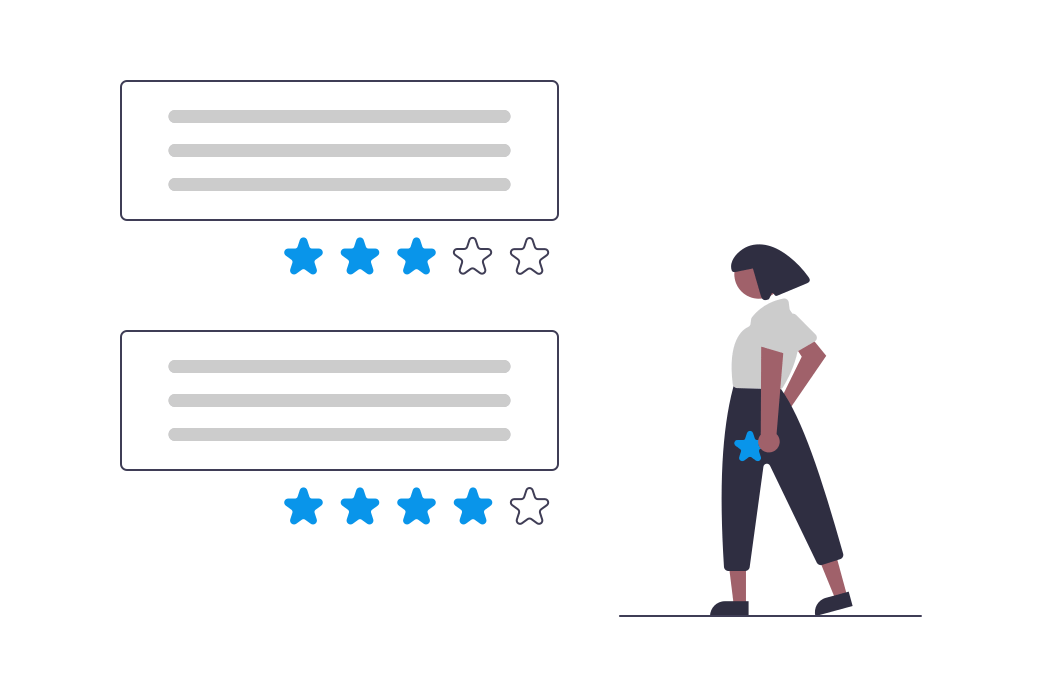
- Asking users to rate an onboarding phase
- Directing them to a user forum where they can discuss any potential issues with other users
After collecting the user experience data from your clients, you should press your efforts to improve your onboarding process and make it outstanding.
Now it’s time to address resolving customer issues.
Response Time & Escalation Resolve Time
If you want your onboarding process to swipe users off their feet, you must measure Response Time and Escalation Resolve Time as a key SaaS metric.
There’s nothing so irritating as customer support that takes forever to get back to you and help you with your problem.
Measuring this metric lets you know how quickly your SaaS support agents respond to your users’ queries.
Since every quality onboarding experience attempts to help users resolve issues, having a quick response and escalation resolve time is imperative.
In short, if you want to offer an exceptional onboarding process, work on resolving queries quickly.
When speaking about this metric, there’s an essential distinction between response time and escalation resolve time.
Response time is the first half of this metric, and it means the time it takes for your CS agents to pick up on support requests from your users.
On the other hand, escalation resolve time is the time that elapses between receiving a support request and solving it.
It’s important to differentiate them because you have to pinpoint which part of the process is slow and needs tuning.
If your team is quick to respond to user queries and solve them at a moment’s notice, you’re on top of this metric.
But let’s run the numbers.
A study by Site Builder has found that 21% of companies responded to a CS request in less than an hour.
Since response time affects escalation resolve time, your SaaS support would do well to keep their response time close to 1 hour.
Your support has to pick up and solve customer issues quickly, so their learning experience is uninterrupted and nothing shorter than excellent.
Product Adoption Rate
A great thing about tracking your onboarding metrics is understanding how many users will stick to your SaaS.
This metric is called the Product Adoption Rate, but the industry likes to call it stickiness.
Product adoption rate (PAR) tells you the number of users that stay with your product after they’ve tried it out.
If your stickiness is high, your newcomers are adopting your product and turning into fully-fledged customers.
Keeping your PAR high is a vital goal of any SaaS that wants to succeed. It also says something about the quality of your onboarding.
As we’ve said before, your users have to be properly onboarded if you want them to adopt your product.
When they know how to use every feature of your software, they can extract the total value out of it.
If the onboarding is poor, new users will likely miss out on the key features and won’t stick around enough to discover them.
That’s why monitoring your product adoption rate is vital.
Since it’s not that hard to calculate, your team should do it regularly.
To get it, divide the number of new active users with your new sign-ups and multiply it by 100 to get a percentage.
So, let’s say you’ve had 80 new sign-ups and 60 new active users.
PAR = (60/80) * 100 = 75%
In other words, 75% of new users will stick to your product.
Let’s keep talking about the value users get from your SaaS.
Time to First Value
We can’t talk about the value of your software without looking at time to first value.
This metric refers to the time from when the user signed up for your SaaS to when they first got value out of using it.
It’s important to note that when users sign up for a product or service, they expect to see value from it right away.
If it takes forever for them to realize what they’re getting out of the service, they’re going to cancel it before the end of the month. Keeping this metric as low as possible is the best thing you can do to show value.
Here is where powerful onboarding makes a tremendous difference.
When you onboard new users effectively, they end up knowing how to use your SaaS to its full extent.
As a result, they don’t have to wander around the dashboard and get a taste of its value right away.
How you go about your onboarding process has a direct impact on your user’s time to first value.
In case you’re having a hard time determining the time to first value of your SaaS, we’re happy to help.
Try these tips for size:
- Adopt a customer-centered approach, so your users feel valued even before they’ve mastered your SaaS
- Improve your onboarding experience tirelessly
- Communicate the values of your SaaS to your customer through your CS.
- Ask customers directly have they tried a specific feature and recommend in-app actions that could derive value.
Reducing the time to first value requires your team to take a proactive approach.
Measuring this metric is essential for understanding how long it takes for users to get value out of your solution.
Free-to-Paid Conversions
How many users convert from a free to a paid subscription is the true testament of your SaaS and its onboarding process.
Tracking the free-to-paid conversion rate is essential for top SaaS user onboarding metrics.
Only the most satisfied users decide to switch from free to paid services, and the data you get from them is the key to your success.
Tracking this metric enables you to understand the total effectiveness of your conversion process and spot places for improvement.
Naturally, it also speaks volumes about your onboarding process.
We can’t stress enough how impactful onboarding is to achieving more paid conversions.
When you properly onboard your users, they’re quickly able to see the value of your SaaS and are usually eager for more.
Users who experience the usefulness of your app will convert to paying customers once they’re impressed with what your SaaS does for free.
You might want to ask, what are good free-to-paid conversion rates?
While there’s no definitive answer, aim to achieve a minimum of 25% conversions from free to paid SaaS users.
After reaching that point, you can zoom into the specifics and see how you can improve those numbers.
Free-to-paid conversion rates are a classic example of a metric that thrives on the quality of the onboarding process.
User Retention
Last but not least, we have to have a talk about the user retention metric and what it means for your SaaS onboarding.
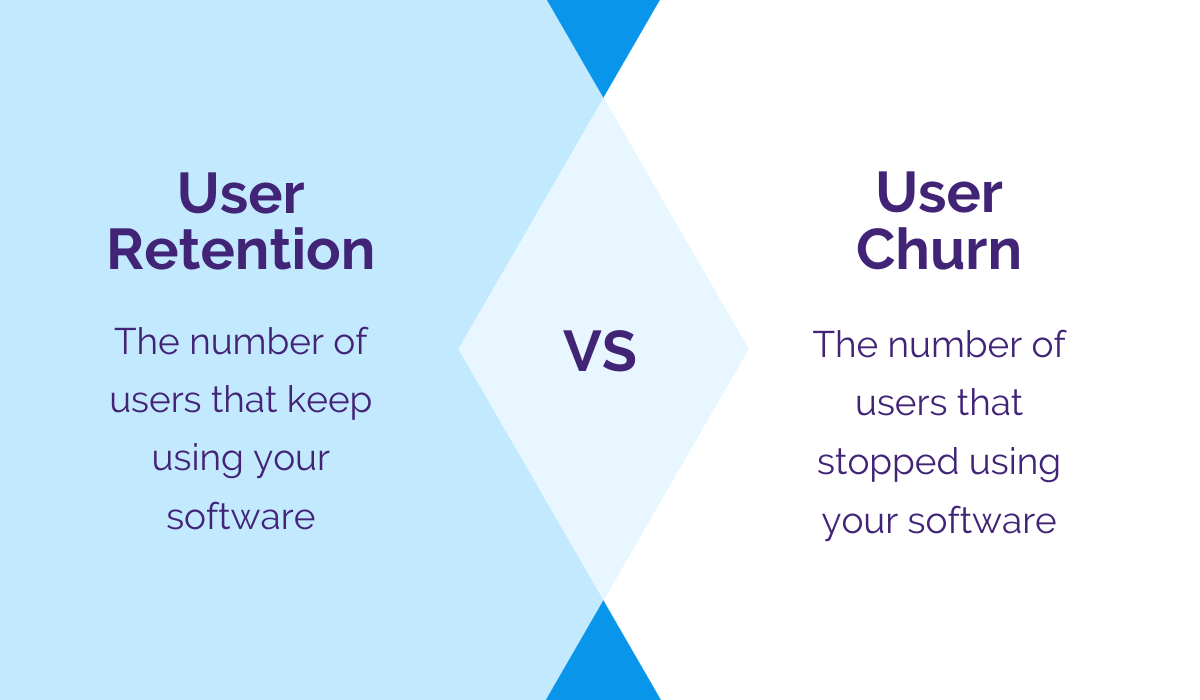
User retention is the rate of users that remain using your software.
Its twin metric is called the churn rate, which is the complete opposite; it shows the number of users that stopped using your SaaS.
Keeping your churn rates as low as humanly possible is a top priority. The number of users churning from your SaaS reflects on the effectiveness of your onboarding process.
Naturally, this makes user retention/churn rates a high-profile metric for improving your onboarding.
You see, when you deliver an exceptional onboarding experience to your new users, they know how to get the maximum benefit from your software.
They’re not wasting their time or questioning why they signed up for it. Instead, they know exactly what they’re getting out of your software. And that’s all because of your onboarding.
If you think the onboarding process has little to do with user retention, check the facts.
According to statistics by Appcues, a user retention can be up to 50% higher with a fantastic onboarding experience.
Therefore, if you want to keep your users from churning, make sure your onboarding process is top notch.
The way you go about improving your onboarding will play a massive role in the user retention rates of your SaaS.
Conclusion
In this guide, we’ve provided an in-depth look at user onboarding metrics and how they align with the success of your software.
Keeping a close eye on these top metrics will help you improve your onboarding to where users will be lined up to use your SaaS.
Remember, the best way to start a user journey is with top-of-the-line onboarding.
Start tracking your metrics today to break user satisfaction records tomorrow!