10 Key Metrics for SaaS Reporting

saas reporting metrics

SaaS businesses have a unique set of challenges these days. With the growing competition, it’s hard to scale, and some SaaS businesses struggle to even achieve profitability.

To make the best decisions for your business, you mustn’t rely on your gut. You need to make data-driven decisions that will help you direct your company in the right way and strategize for future success.

There are a lot of factors to consider but if you know what you need to track, the process of running a profitable business becomes easier. 

The following ten metrics will help you start on the right foot and have a wholesome view of your business. 

Jump to metric:

Monthly Recurring Revenue (MRR)
Annual Recurring Revenue (ARR) 
Churn Rate
Customer Lifetime Value (LTV)
Average Revenue Per User (ARPU)
Customer Acquisition Cost (CAC)
Free-to-Paid Conversions
Net Promoter Score (NPS)
Burn Rate 
Customer Engagement Score

Monthly Recurring Revenue (MRR) 

MRR is the most critical metric in the SaaS business.

It’s the reason why most people get into the SaaS business. The predictable revenue. You don’t have to rely on one-off sales, and you can make better plans for the future. 

MRR shows you how predictable your business is.

Simply put, MRR tells you how much income you generate each month and helps you track your growth over time. It’s pretty easy to calculate too. 

Just multiply the number of customers you gain each month (and recurring ones) with their averaged billed account, and you get your MRR.

mmr formula

SaaS companies’ biggest mistake is to focus on micro rates, i.e., daily transactions and revenue changes. 

But don’t stress too much on the micro assessment of your business. 

When it comes to SaaS revenue, you should focus on monthly changes as the smallest part of your overall growth. Growth doesn’t happen overnight or in a single week, but with consistent positive trends.

However, it’s not enough just to calculate your top-level MRR. You have to take into account other factors happening over time that also affect MRR. 

It’s silly to focus only on new customers that generated $3000 in MRR when you also have churn rates of $4500. 

That doesn’t show your business is growing, right? Having the correct data is essential. 

So, here are some useful additional MRR types that you need to include in your Net MRR:

  • New MRR – MRR from new customers
  • Expansion MRR- MRR from existing customers (upgrades)
  • Reactivation MRR – MRR from previous customers
  • Contraction MRR – Lost MRR from existing customers (downgrades)
  • Churned MRR – Lost MRR from canceled customers

With this knowledge, you can easily adjust your business strategy because you are aware of how much money you can generate in a given time. 

Tracking your MRR is extremely useful because it helps you see trends and the overall health of your business. 

Annual Recurring Revenue (ARR) 

ARR is another excellent indicator of overall business health.

B2B SaaS businesses with yearly subscriptions mostly use it. Tracking ARR for monthly subscriptions is not particularly useful since churn and conversion rates are more frequent.

Just like the title says, ARR shows how much money you’ve acquired through your recurring billing plans over one year. 

While it is used almost exclusively in B2B businesses, everyone can use it almost as an addition to MRR. It’s easier to make financial decisions monthly by tracking MRR, but ARR is more useful as a valuation metric.

So, you should use ARR (if you aren’t already) as a report for: 

  • Growth from new contracts
  • Net and gross expansion and contraction from existing customers
  • Trends in average selling price
  • And to estimate future GAAP (generally accepted accounting principles) revenue. 

Also, using ARR can help in future acquisitions since the yearly revenue is used as a metric in most traditional businesses and prospective investors mostly think on bigger scales than on a month-to-month basis. 

Churn Rate 

Churn isn’t a sign of failure. Well, it is, but churn is unavoidable in the SaaS business, so it really shouldn’t be that big of a deal. 

In the most basic terms, churn means the number of subscription cancellations. 

General advice is to keep your churn rates as low as possible, but the healthy rate in most businesses is an annual 5-7%. Customers leaving is terrible, but who leaves and how much money they take with them is a whole other story.

You should focus on two components of your overall churn: customer churn and revenue churn.

Customer Churn

The easiest way most companies measure churn is per customer, and it is calculated monthly. 

You have to divide the number of churned customers by the number of total customers in a given period. 

So, if you have 100 customers in a month and 7 leave by the end, your customer churn is now 7/100=0,07 or 7% customer churn.

Here’s additional advice: you must track both your monthly customer churn and annual customer churn

Why?

Because what seems like a reasonable number on a month-to-month basis (e.g. five customers leaving) can quickly turn into an avalanche of a problem yearly. 

Using the formula below, we can quickly see how big of a problem it is.

Our monthly churn was 7%, so using the above formula, we get: 

Annual Customer Churn Rate = (1-(1-0.07))12, which turns out to be a massive 58% annual churn rate! 

While monthly calculated customer churn can help you gain insight into the daily operations of your business, it is the annual customer churn rate that you should look out for if you want to stay in business.  

Revenue Churn

How many customers churn can help us little if we don’t know how much money they take with them. Losing five customers with a $20 subscription plan is not the same as losing five customers with a $2500 monthly subscription plan.

Revenue churn means the amount of recurring revenue you lose from cancellations. 

Imagine this: We’re at 7% customer churn, but those who left were big clients with the biggest subscription plan. Let’s say your MRR was $70,000, and they accounted for $20,000, which gives you a revenue churn rate of 28%. 

Comparing your customer churn and your revenue churn now gives us a completely different perspective on how your business is doing. It’s easier to convince yourself everything is fine if you only look at that 7%.

Luckily, these numbers can help you understand what is happening so you can make the necessary steps to lower your churn as much as possible.

Average Revenue Per User (ARPU) 

 Now, you might be asking: “Why do I need the ARPU? I’ve already got MRR, ARR, my churn rates, and LTV. Why is ARPU important?” 

Well, it measures the quality of revenue your business generates.

ARPU means what it says: the amount of money you get from a single customer in a given period. Now, how is that different from LTV? Good question.

LTV tracks the amount of money you get from a customer until they cancel, and it’s a measure of your retaining strategies more than anything else. It can help the marketing team and show how successful your customer success team is. ARPU is used to evaluate the quality of revenue growth and should be used to modify pricing and your position in the industry.

ARPU numbers can help investors see which type of revenue companies attract, i.e., if they’re low or high revenue generators. It allows the analysis of a company’s growth at the smallest scale – per user. For younger companies, it’s better if their ARPUs have a positive trend since most investors expect that.

A simple formula for ARPU is this:

ARPU formula

It’s useful for future predictions on a monthly or quarterly basis. But ARPU also considers other factors that fall under MRR calculations, such as upsells, add-ons, downgrades, and churn.

Sidenote: there is a difference between ARPU and ARPPU. The latter means average revenue per paying customer. If your company offers a freemium, your ARPU and ARPPU metrics will be different.

ARPU can help you categorize your customer base and analyze how each segment is performing. It can help you with pricing strategies because it’s generally more profitable to raise ARPU through upgrades and upselling than to acquire new customers. 

While other metrics can help you see how your business is doing, ARPU can help you strategize on a long-term plan and convince potential investors to see value in your company.

Customer Lifetime Value (LTV)

How much money does a user spend on your product during their subscription? 

When it comes to LTV, there are no possible benchmarks to track. It depends on numerous business factors (product changes, economy, sector, competition, etc.), making projections difficult. 

It’s even more complicated for businesses with a diverse customer base or different pricing tiers. General advice is that LTV should be at least 3x greater than CAC (Customer Acquisition Cost).

So, is it even worth measuring it? 

Of course, it is! LTV can help you decide on the long-term value of your product and increase your revenue. Here’s a very simplified formula to measure LTV for one customer.

LTV formula

The most important thing about LTV is that it helps you make better marketing and sales decisions. More importantly, it affects your CAC. It’s not worth spending $400 to acquire a customer that will only generate $100. These two metrics have to work in sync so you can grow your business faster.

You can help yourself in the acquisition process to target customers who will be more likely to opt for your mid-range or higher pricing tiers to increase your retention rates. Retention plays a significant role in LTV. A general rule is that people using the lowest-priced tiers are more likely to churn, so your LTV will be abysmally low. 

The first tip on how to increase your LTV is to increase customer satisfaction. 

Get right to the center of your problem. 

Interview your longest customers with the highest lifetime value and learn everything you can. 

  • Where do they get the most value out of your product? 
  • What initially drew them to you, and how do they use the product? 

The final solution is to raise prices or expanding your customer base. Raising prices might sound off the alarms, but shouldn’t do anything drastic without proper analysis anyway. 

You might be surprised by how much customers are willing to pay for good service, especially if they can’t live without a product. 

Customer expansion might be a more straightforward route. You’re trying to increase revenue from your existing customers with different tactics: upselling, cross-selling, and offering add-ons. 

Some might take the bite, but others won’t. It’s still worth a try.

Customer lifetime value says a lot about the value your customers get from your product. It can be a tell-tale sign that you found a market fit or that you’re likely to need to find other ways to keep your churn rates low. 

Customer Acquisition Cost (CAC) 

First-time SaaS founders are often shocked after seeing how much they spend on CAC. 

They find a great product/market fit, but they don’t realize that getting people to buy their product is a lot harder than it looks. Customers will not come running to you.

Customer acquisition cost measures the money you spent acquiring a new customer through sales, marketing, or other channels. You can calculate CAC by dividing the figure spent on marketing in a month by the number of acquired customers in the same period.

As mentioned before, this metric is closely related to LTV since it shows if your business is making sensible marketing strategies and attracting the right customers (i.e., those who will have higher LTV). 

Acquiring new customers can be costly, especially for startups who need to burn funds to create their first customer base and don’t see profits for months (or sometimes years).

Some estimates are that a company needs to cover CAC in the first 12 months to survive. The faster you cover your CAC, the sooner you can reinvest that money into other things or back into marketing with better solutions to raise your LTV.

How to lower your CAC? 

Improve conversion rates (which is easier said than done). Target the demographic which will benefit the most from your product and reduce your acquisition costs by attracting the highest converting types of users. 

The key is to develop a business model that will help you profit from your customers and lower the costs included in the acquisition. Focusing on growth is good, but you shouldn’t close your eyes at the costs too. You can use CAC to make better decisions and predict if your business is on the right track for steady growth.

Scaling is easier once you know the actual cost to acquire a customer.

Free-to-Paid Conversions 

 For SaaS companies, the conversion rate is what drives all the other metrics.

Conversion rate refers to the percentage of customers who become paying customers. Or, if you have trials, the number of those who upgrade their subscription plans.

This metric shows that your product is of value to users enough to pay for it. Depending on the type of business you are and the type of trial you have, a good conversion rate is anything between 25-60%.

To calculate it manually, take the total number of customers for a given period (say, a month), divide it by the number of trial users, then multiply that number by 100. 

Here’s how it looks like:

conversion formula

You have 7 new paying users and 500 people in the free model. 7/500×100= 1,4% That gets you a 1.4% conversion rate in a given month.

This metric has multiple uses. First, it’s the easiest way to show your onboarding and retention strategy is paying off. 

Also, don’t forget the power of personalization to get you higher conversion rates. A customer who uses your product for personal use will have different needs and lower revenue options than your enterprise customer.

Customer feedback is your golden goose for reasonable conversion rates. You can optimize your subscription plans, add features, and more once you implement your customer’s wants.

Analyzing conversion rates helps you monitor typical behavior and shape targeted and more successful marketing campaigns.

Net Promoter Score (NPS) 

We’ve discussed many critical financial metrics, but here we have one suitable for measuring customer loyalty. Net Promoter Score is the direct measurement of how much value your customers are getting from your product.

It is mainly used to inform your customer success team to improve onboarding strategies and help you reduce churn.

In your customer base, you have three types:

  • Promoters – people who like your product and are likely to spread good things about it 
  • Passives – people who use your product but aren’t too enthusiastic about it
  • Detractors – people who don’t like your product and aren’t very likely to promote it

You’ve probably seen a question like this while using some kind of service:

NPS example

You measure your NPS score by subtracting the percentage of promoters from the percentage of detractors. Like this:

% Promoters – % Detractors = Net Promoter Score

Let’s say you had 76% of people who answered 9-10 on your questions and 32% who answered anything between 1-6. Your NPS is now 76-32= 44. 

Is that a good thing?

Statistics and recommendations regarding NPS scores have changed drastically over the years. Just in 2018, a widely recommended score was above 50, but just a year later, that number dropped to 30.

Whatever your number is, use it for your internal business plans. Using customer feedback is vital to understand how valuable your product is and make adjustments. 

Don’t take these numbers too seriously but focus on what can be done with them to grow your business. It is not a viable market research tool. It’s far too simplistic for that, but it can be a good start in making initial decisions and testing how your customers feel about you. This is one of the many questions you ask your customers to improve your onboarding and conversion rates.

Don’t just focus on happy customers either. 

Detractors might be more valuable to you in terms of acting on product optimization and making changes. When customers feel like they’ve been listened to, their relationship with your company becomes stronger, and you’re more likely to gain more advocates and promoters. 

Remember, people are more focused on negative experiences than positive ones, and by catering to your passives and detractors, there’s a good chance you might dissuade them from spreading negative stuff about your company. In all likelihood, once you address their problems, you can even retain some of them.

Emails have a lower response rate, but they can be used as a tool for gathering additional data. If your customers answered nine on the survey, you can send them an email and ask why they liked your product so much. 

NPS promoters email

Some might say that using one question to measure NPS is not accurate. Well, it isn’t if it’s not backed up by the following ‘why’ question.

Using NPS on its own doesn’t give you the best information about your company and your customers, so it’s best to use it in combination with other metrics to get a complete picture of how your business is doing. 

Burn Rate 

Looking at money coming in is fun, right? 

But to make money, you have to spend money. And in that context, burn rate is another metric you should keep a close eye on. It doesn’t matter if your business generates $15,000 in a month if you’re spending $20,000.

Burn rate measures the amount of money a SaaS business spends in a given period. 

It can include the cost of goods, sales, payroll, and administration. This metric is more relevant to startups since they don’t have a significant and regular cash flow, so they’re likely to ‘burn’ their available funds.

Two types of burns are important: gross and net. Gross burn means the expenses you use every month; net burn is the leftover amount or the cash flow. 

The formula is here:

Total revenue – gross burn = net burn

Net burn can either be negative, breaking even or have positive cash flow and profits.

When people refer to the burn rate, they only mean losing money. The good news is that burn rates can vary. Some months you might earn more, some less. 

There is no need to panic. 

So, how do you buy your company more time to become profitable and get rid of the burn rate? 

The easiest solution is getting more money! 

Be it from funding rounds or by raising prices for your customers; the choice is yours.

The burn rate is not a loss. Spending money can be justified if you redirect into growth. 

Combining this metric with others can help you evaluate the trajectory your company is heading in a much clearer light.

Burning money, be it your own or investors’, is never an easy decision, but if you calculate it correctly and make necessary changes that will ensure future growth, a short-term burn can keep you warm long-term.

Customer Engagement Score

Use Customer Engagement Score to identify how much value your users get from using your product regularly.

The customer engagement score is a bit trickier to calculate because every company is different, and their goals for customer engagement vary. 

It’s important to remember that SaaS businesses rely on people using their products and finding value in them. Or, more precisely, finding regular value in them through their actions.

This metric is helpful across the whole company, but it is far more helpful to your teams who deal with customers directly or indirectly. Sales and marketing can easily detect and prioritize accounts that are more engaged to find upselling and conversion opportunities.

Engaged customers are more likely to reduce your churn. 

A customer engagement score can also help you identify engagement drops with your leading accounts and identify good customer fit. 

It’s a more specific score than NPS because you’re only focusing on engaged customers, and you’re monitoring their behavior to know how they are using your product.

Customer Engagement Score is a reasonably customizable methodology that should fit every company individually. Your first step is to find actions that you can use as a criterion in measuring engagement. 

For some companies, that might mean the number of emails sent, or for others, the number of website visits. Whatever works for your product, use that. 

But if you’re still unsure of what to focus on, here’s what’s used in the industry the most: 

  • New sessions started
  • Website visits
  • Projects started
  • Messages sent
  • Features used

Once you know what you want to track, find events in-app that users engage with, and that can help you identify how successfully they’re using it. 

For simplicity, track 2-3 events that include the core features of your product. Then, just add a score to each event to see how frequently it’s used. Compare your expectations with the actual number of occurred actions.

In sum, don’t let churn rates spike uncontrollably. 

Engage your users so they’ll happily pay you for a long time. The longer they use your product, the more indispensable it will be in their daily routine, and thus, they are more likely to become a loyal customer.

Conclusion

There are a lot of things you can measure these days when it comes to your SaaS business. 

But a lot of metrics are only clouding your judgment or making you look better than you really are. 

By focusing on these 10 key metrics you have a good overview of how your business is doing, whether it’s growing and how your customers are feeling about you and your product. 

We hope this article has taught you a thing or two about Saas metrics so you can optimize and grow your business faster. 

About The Author
Asaf Darash
CEO and Founder of Regpack

Asaf, Founder and CEO of Regpack, has extensive experience as an entrepreneur and investor. Asaf has built 3 successful companies to date, all with an exit plan or that have stayed in profitability and are still functional. Asaf specializes in product development for the web, team building and in bringing a company from concept to an actualized unit that is profitable.

What is Regpack?

Regpack is an online registration software that creates intelligent application processes with integrated payment processing.
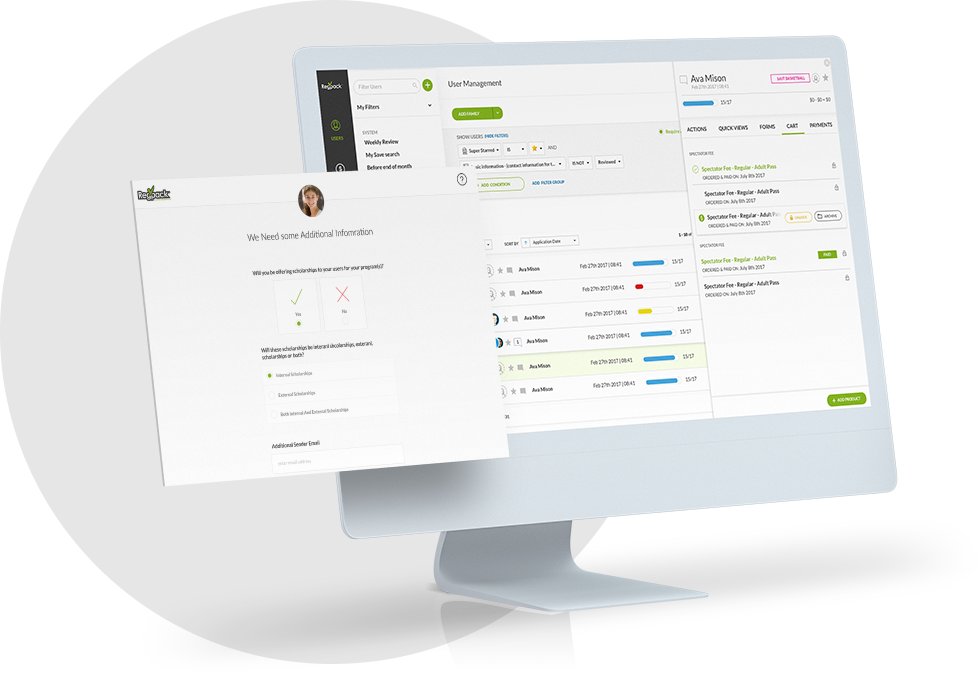
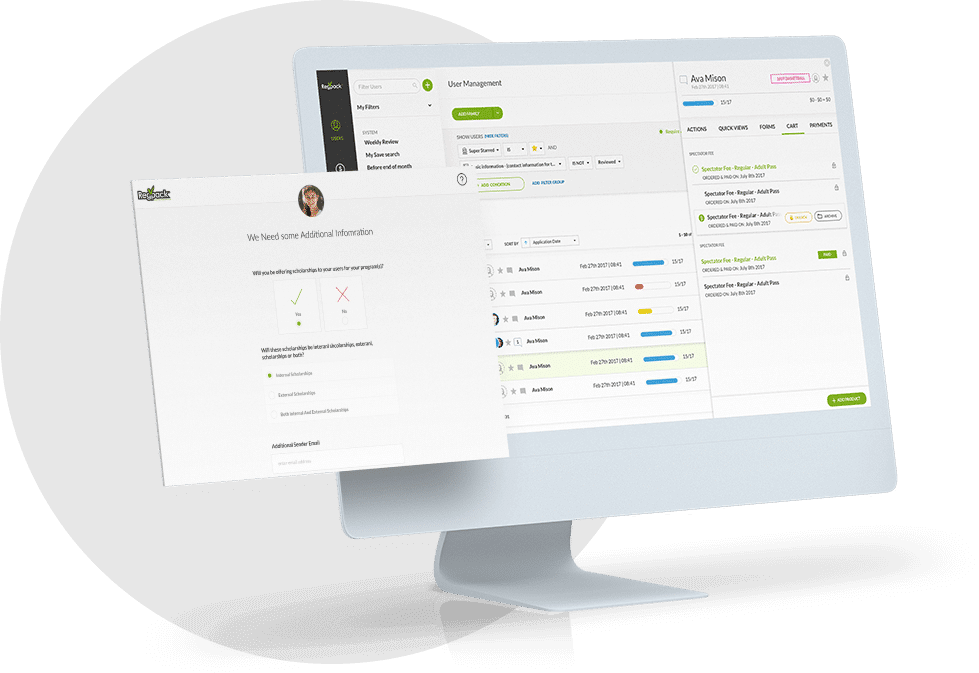
Your Process, Automated
Find and create applicant groups according to YOUR needs. Automate your online registration.
Your Website, Our Technology
Don't send applicants away! Embed your process seamlessly onto your website.
Integrated Payment Processing
Applicants can pay easily within the registration process. Manage payments, send invoices, and more!
Save 60+ Admin Hours Every Month!
Online registration automation tools that work for you! Save time and work smarter.