Retaining customers should be your priority if you run a SaaS business.
After all, the more loyal customers you have, the more revenue you stack up. And not growing as a SaaS company means you might run out of business faster than you think.
Also, if you keep in mind that it’s five times cheaper to retain a customer than to gain a new one, it becomes even more apparent why customer retention is essential for any business.
Since customer retention is so vital for SaaS products, you should keep track of retention-relevant metrics that let you know how well you’re doing.
The different calculations can point to problems you might have with your customer base, which lets you solve them before losing your users.
Regularly keeping track of customer retention metrics allows you to lower your churn rates and increase customer satisfaction, so here are the nine essential metrics to know.
Customer Retention Rate
The customer retention rate metric lets you understand the percentage of customers you retain over time, i.e., how many customers renew their subscriptions and invest in your product again.
This metric shows you just how efficient your customer retention plan is. If the number is lower than you want it to be, it’s time to rethink your strategy and make customer retention your focus.
And if you figure out how many customers you lose regularly, you can discover underlying issues and fix them to increase retention.
But how can you start?
To calculate the customer retention rate, first select a period you want to measure. Then, determine how many customers you had at the beginning of the period, how many you had at its end, and how many customers you gained during it.
[(number of end customers - new customers) / number of start customers] x 100
Let’s say you want to measure your monthly customer retention rate. And the situation was like this. At the beginning of the month, you had 150 users. You’ve gained 25 new customers, and at the end of the month, you had 160 users.
Your retention rate, as per the formula, would be 90%. Of course, the goal is to get a perfect 100%. However, this isn’t exactly attainable for each SaaS company. A lot of it depends on the size of your company and its annual revenue.
Here’s the industry standard in annual customer retention, based on the annual contract value:
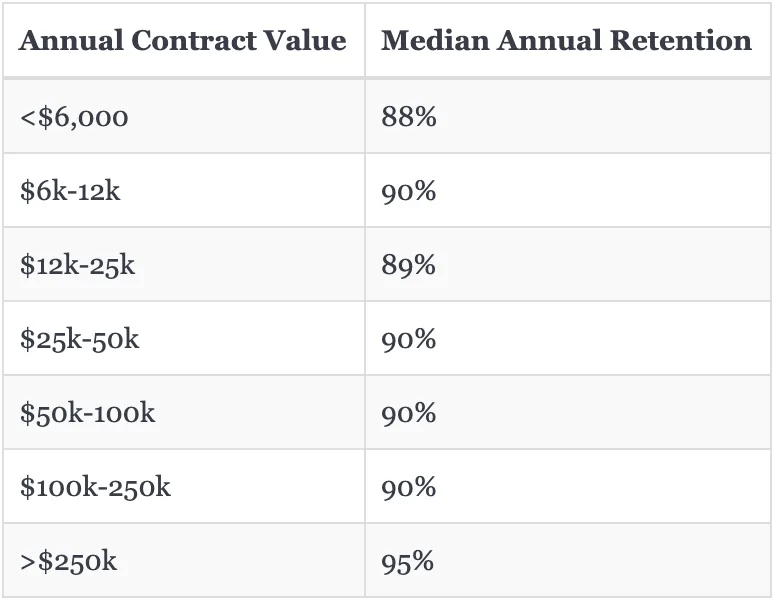
Source: saas-capital.com
Clearly, smaller businesses will have a more challenging time reaching the perfect retention score, while those who earn over a quarter of a million annually per contract should have a close to optimal score. If they don’t, something’s wrong!
If your retention rate is low, here’s a tip—focus on keeping your customers happy and improving your product as much as possible!
Churn Metrics
SaaS businesses heavily rely on low churn results, so it’s essential to track churn metrics.
Such metrics help you figure out how many customers stopped renewing their subscription and, consequently, how much revenue you’ve lost. Clearly, you want to keep those rates low. There are several different churn metrics, so we will explain them.
To calculate the customer churn rate, you have to understand how many customers you’ve had at the beginning and the end of the given period.
[(customers at beginning - customers at end) / total customers at the beginning] x 100
Suppose you’ve had 150 customers at the start of the month but ended the month with 120. In that case, your customer churn rate would be 20%
On the other hand, the monthly recurring revenue (MRR) churn shows you the impact of customer churn on your revenue—it shows you how much income you lose when you lose clients.
If you’re trying to calculate MRR churn, divide the MRR from the start of the month by the value of canceled subscriptions at the end of the month.
(start of the month MRR / end of the month subscription value loss) x 100
Let’s say you started the month with an MRR of $20,000, and you ended it with a $2,500 loss. That month’s churn rate is 12.5%.
It goes without saying that the lower your MRR, the slower the growth of your company. It’s precisely why measuring this metric is vital if you want to keep your SaaS business healthy.
So, what can you do to lower your churn rate?
If your rates are concerning, you have to understand why and when your customers leave.
This knowledge helps you realize what you need to fix and allows you to eliminate the problem immediately without causing even more damage to your revenue.
Unsure of what it could be? Here are some reasons:
- Complicated product
- Substandard onboarding
- Poor customer service
- Insufficient staff knowledge
- Bad marketing
- Late or incorrect invoicing
- Low value for money
Whatever the reason, you won’t see any progress until you get to the bottom of it and develop a strategy that works.
Speaking of which, let’s see how ConvertKit, a SaaS email service provider, lowered its churn rate by an impressive 15%.
Matt Ragland, ConvertKit’s onboarding lead, explained that he sent each new customer a personalized video where he personally greeted them, wished them a warm welcome, and offered a piece of advice based on the customer’s information he had.
As you can see below, the customers really enjoyed it:
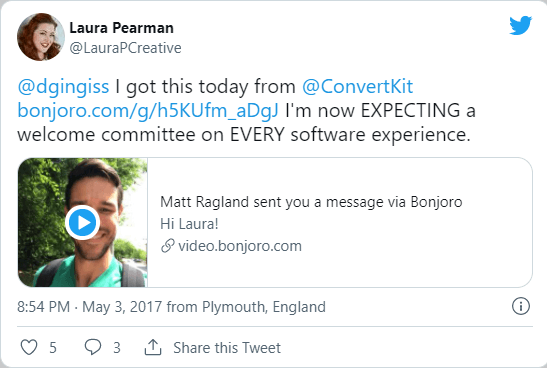
Source: @LauraPCreative
Imagine receiving such a warm (and helpful) welcome when you sign up for a subscription! No wonder their strategy worked—who doesn’t like a personal touch?
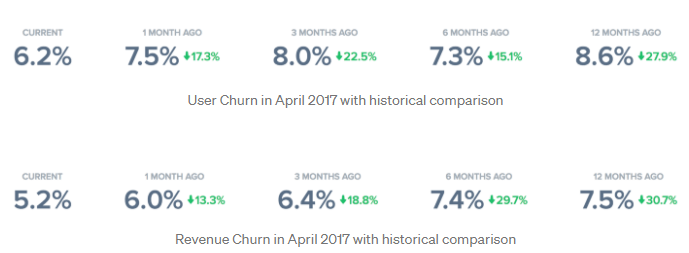
Anyway, these were their churn results:
Source: medium.com
Obviously, ConvertKit’s strategy worked, and they had the numbers to back the decision up.
The best part about it was that making these videos was cost-effective and wasn’t that time-consuming as they were all filmed in under a minute.
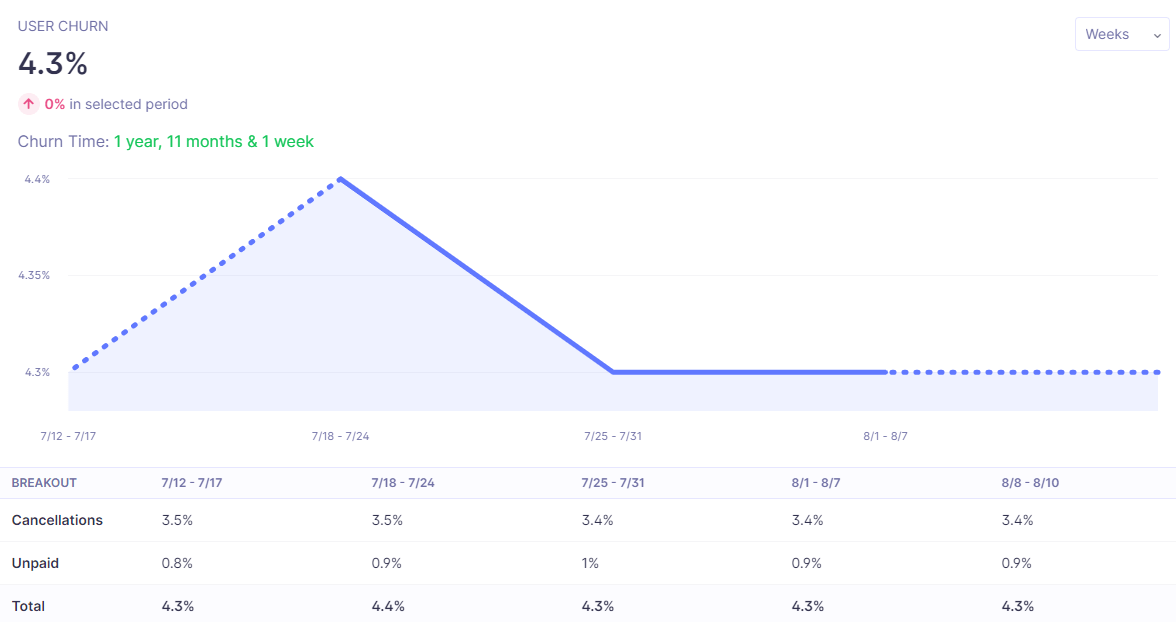
If you’re still not convinced, here’s how ConvertKit is doing at the time of writing this article:
Source: Baremetrics
As you can see, their churn rates are still going down, and they seem to be on the right track.
If you take anything from this section, let it be this: be creative when developing your churn reduction strategy.
Average Revenue Per User (ARPU)
The average revenue per user (ARPU) metric depicts how much you earn from a single customer.
As a SaaS company, you have to measure ARPU.
After all, you are paid regularly, so knowing what kind of revenue you can expect from your customers is an essential part of your business.
But if you notice that your ARPU is declining, look into the reasoning behind it. If customers are paying the bare minimum and leaving, you have a problem.
So, let’s see how you can calculate ARPU and know where you stand.
First, you have to know the total amount earned in the given period and the number of customers in that same timeframe. If you offer a free subscription tier, you shouldn’t consider such customers when calculating ARPU as it should refer to paying customers only.
the amount earned / number of customers
Suppose you earned $250,000 in a year, and you had 5,000 customers that year. Your ARPU would be $50.
Still, remember that the ideal ARPU depends on the size of your business and your industry. Therefore, the best way to see if you’re doing well is to compare yourself to some of your competitors.
To increase your ARPU, you can raise subscription prices or offer more options, making customer expansion possible. But you have to do it properly!
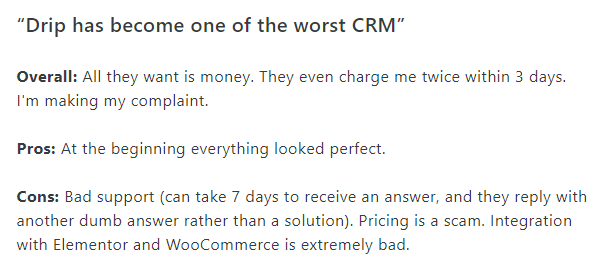
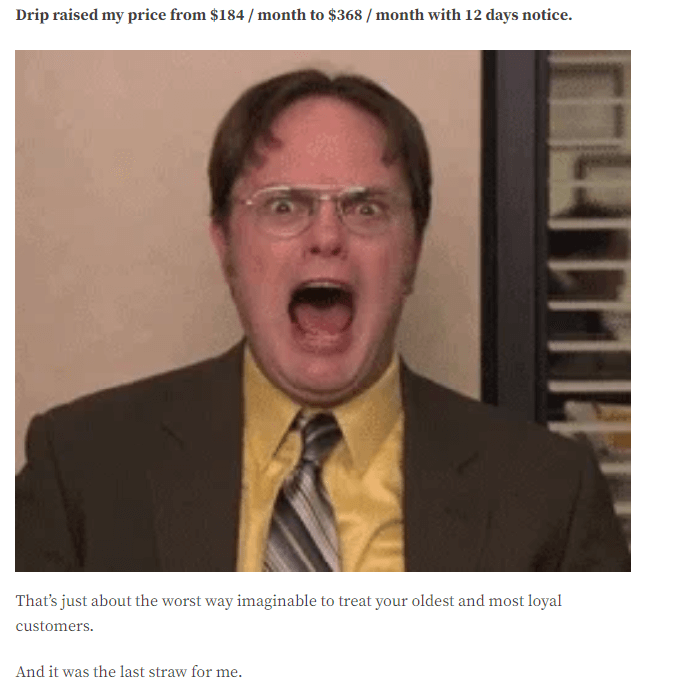
Here’s what happened to Drip, a marketing automation platform, when they decided to raise their prices and ended up almost doubling them:
First, they angered customers:
Source: capterra.com
Second, they lost loyal customers:
Source: ryanwaggoner.com
And third, their competitors (namely ConvertKit) had a field day and used the outrage to their advantage:

Source:@nathanbarry
So, if you want to make a quick buck by doubling your prices, learn from Drip and focus on doing it right instead.
Opt for Jason Lemkin’s tactic and go slow.
Don’t charge more for the already existing set of features—offer new and exciting ones for a higher price. After all, upselling works!
Other than pricing, you can offer various additions to your customers, such as:
- an upgraded version of the product—a better, more refined version of the essential product
- cross-sell—offering a complementing product to the one they already purchased for better, faster results
- add-ons—selling additional features or functionalities on top of the essential product
Jason also suggests not changing the pricing for old customers.
Why? First of all, as you grow, your most loyal customers make up a small percentage of your customer base.
Why charge them more for something they have helped you build?
Instead, Jason recommends:
“Don’t be afraid to raise prices on new customers, over time. You’ve got the mini-brand, the reference customers, the enterprise features. Just be careful on existing ones.”
Change the pricing by offering more subscription tiers and adding new features, which some of your clients will surely look into and accept.
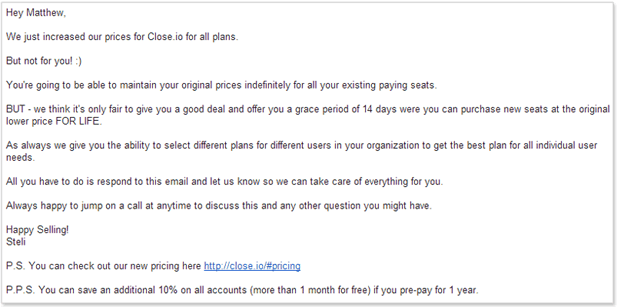
Here’s how Steli Efti, CEO of the sales CRM Close, shared the price increase news with their customers.
Source: blog.close.com
What do you think of the strategy? The email appears personalized and professional.
Most of all, it shows care for the existing client base. No wonder they’ve received positive reactions!
Whatever option of ARPU increase you choose, don’t forget about retaining your existing customer base!
Customer Acquisition Cost (CAC)
If you want to know how much it costs to gain a new customer, you must use the customer acquisition cost (CAC) metric.
However, don’t forget to include all the resources and expenses that went into getting the customer to purchase your product, such as marketing costs, salaries of employees in charge of acquisition, and overhead costs.
When calculating CAC, you have to know the total cost of customer acquisition and the number of new customers.
total acquisition cost / new customers
For example, if your total acquisition cost was $5,000 and you gained 70 new customers, then your CAC is around $71.
David Skok, a SaaS expert, believes that you should repay the initial CAC within a year. If it takes longer, you’re not on a good path.
He advises to “focus on keeping your CAC low enough to be recovered in a year.”
If you believe your CAC is too high, follow David’s advice and develop a strategy to lower the initial costs. As you grow, you’ll be able to invest more in customer acquisition.
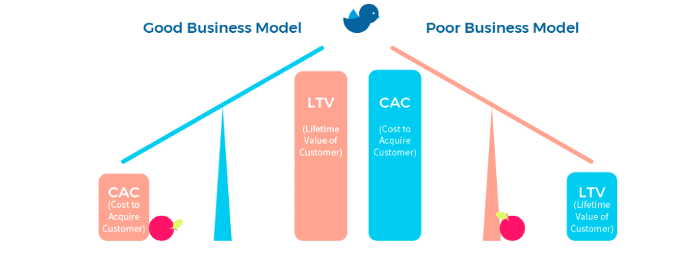
While the CAC metric doesn’t tell you that much on its own, you can use it together with the LTV metric to understand the ratio between the two.
The industry rule is that the ratio of LTV and CAC should be 3:1, meaning that the customers should spend three times more money on your product than you did on their acquisition.
Source: medium.com
If we return to our example above, that would mean your LTV should be at least $213 for the acquisition campaign to be profitable. Clearly, if you spend a lot more money on getting new customers than you earn from them, you have to rethink your strategy.
When experiencing a low LTV vs. CAC ratio, the crucial thing to change is your pricing.
Invest time and money into your pricing page, attract customers, and offer a price that isn’t too high for small businesses but isn’t too low for bigger companies who are willing to pay more.
You may be familiar with the growth statistic that claims that a 1% increase in pricing delivers an 11.1% increase in profit. Even though it dates back to 1992, it is still relevant today as many companies nowadays reap the benefits of increased prices.
So, how can you do it seamlessly?
Think of offering more payment plans instead of having one. Variety helps customers choose what’s perfect for them.
The best part about it? You can scale the price tiers from cheapest to most expensive while ensuring that each customer achieves success using your product.
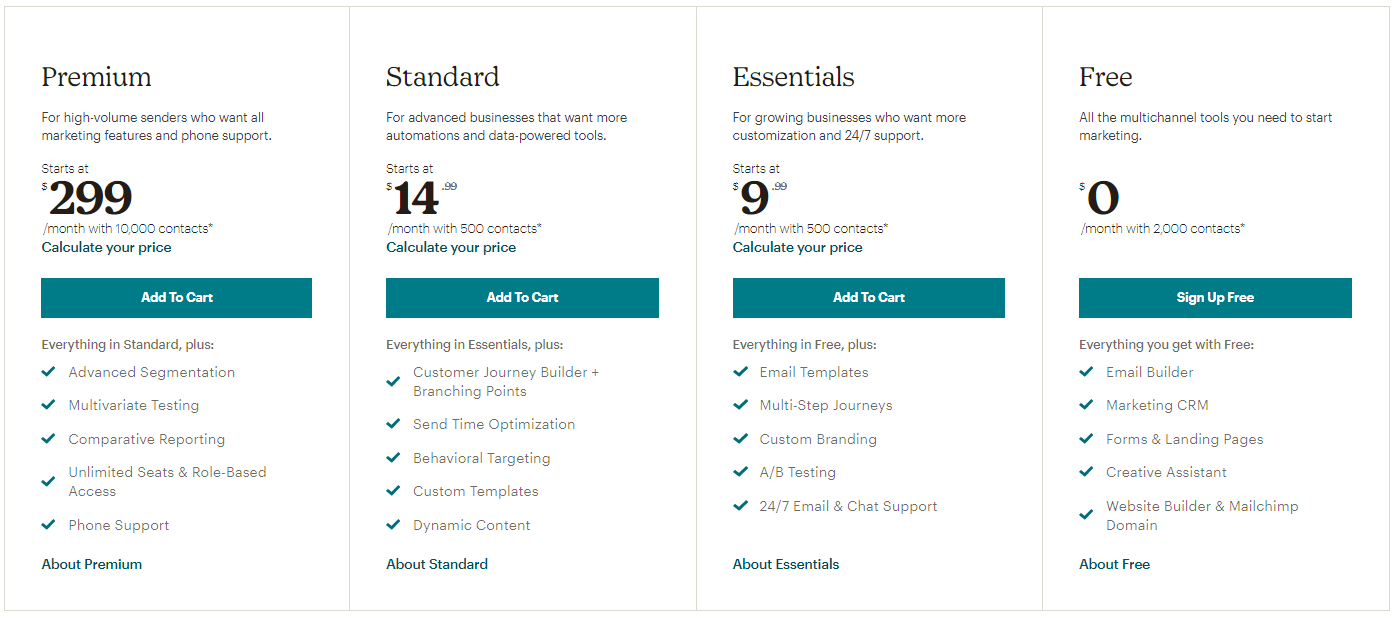
Take MailChimp as an example:
Source: mailchimp.com
They offer four different subscription tiers: free, essentials, standard, and premium. Each provides the customers the ability to use the software and gain something from it, but the more customers pay, the more they get from it.
That’s how it’s done!
In sum, optimize your pricing strategy to lower your CAC and increase the LTV vs. CAC ratio.
Customer Lifetime Value (LTV)
If you want to know how much a single customer is worth to your company, learn about the LTV metric.
The customer lifetime value metric helps you understand how much an average customer will spend while using your product.
Because of the different pricing for various subscriptions you offer, you have to calculate LTV per each pricing level as the number will differ according to these levels. The metric shows you what you can earn by retaining the customer instead of focusing on acquiring new clients.
Of course, your goal is for LTV to rise or stay stable. If your LTV is decreasing, take it as a sign that you need to change the way you do business.
To calculate LTV, you’ll need to use ARPU and figure out how long a customer stays with your company. Is it a month, two, or a year? Find the average and write it down in years.
ARPU x customer lifetime
Suppose your ARPU is $125 and your customers use your product for a year on average. Your LTV for that year would be $125.
Obviously, the higher your LTV, the more valuable existing customers are to your business.
If you’re interested in increasing your customer lifetime value, focus on two things—raising ARPU and reducing churn. To read more about churn management and how to achieve better churn results, click here.
Net Promoter Score (NPS)
Do you know how many of your customers would recommend your product to others?
If you’re interested in that—and as a SaaS business owner, you should be—look into the net promoter score (NPS) metric. It shows you how many of your customers are so satisfied with your products that they would promote them to friends and family.
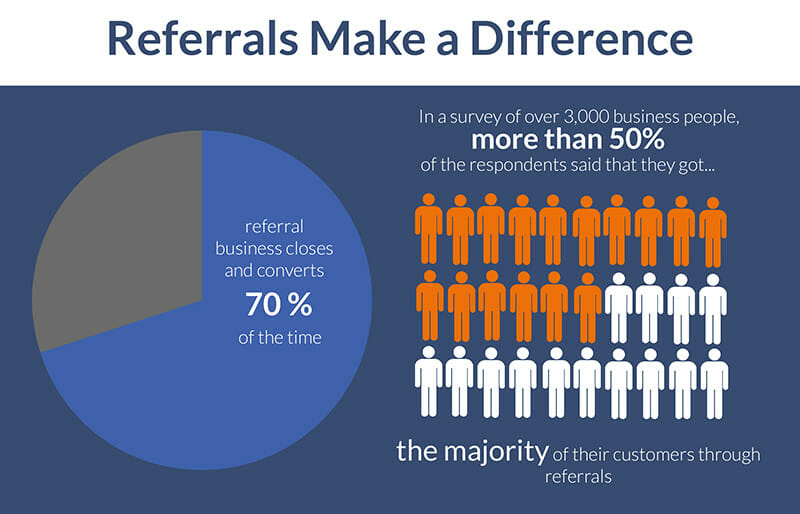
Why does this matter? Because so many people will try out your product based on a recommendation.
Source: bostondigital
As you can see for yourself, referrals work 70% of the time, which is too good of an opportunity to miss out on!
NPS tells you how well you’re tapping into the potential of using existing happy customers to gain new ones, simultaneously decreasing CAC and increasing profits.
To calculate it, you’ll have to find a way to survey your customers. You can do this on your website, via email, or in the app itself.
When asked how likely they are to recommend your product to others, your customers should choose a number between 1 and 10.
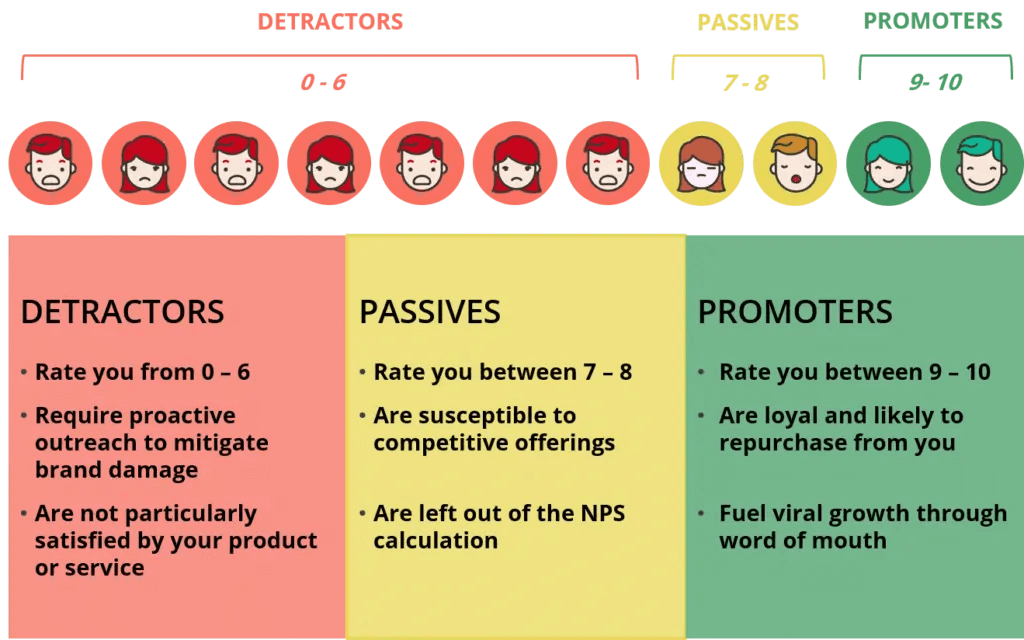
Source: netigate.net
Those who select nine or ten are called promoters as they are very likely to promote your brand to others.
Conversely, those who give you a six or under are detractors because they have clearly not had a positive experience and are more likely not to recommend your product.
The calculation of NPS is simple—subtract the percentage of detractors from the percentage of promoters!
promoters in % - detractors in %
Let’s imagine that 60% of your customers are promoters and 15% are detractors. That would result in an NPS score of 45%.
By comparing the result to the SaaS industry average of 31%, you’d see that your company is above average. However, if your NPS is lower than 31%, know that you have a problem.
In that case, ask yourself why won’t your customers recommend you?
There has to be a problem that makes clients unhappy with your product or service, and it’s up to you to figure it out before you lose the customers.
Get their feedback to understand what issues they’re experiencing with your product if you want to increase your NPS.
On the other hand, you can also encourage your customers to recommend your service to others.
How can you do it?
Just follow Uber’s lead.

Source: saasquatch.com
Uber lets users save money on their next ride if they refer a friend.
You might be thinking: Why is Uber giving away money like that?
And the answer is pretty straightforward: it’s because they’re confident in their service.
Uber believes that if they get a user to try their service, they will stay, which will earn Uber a lot more than the $5 discount they handed out.
Did it pay off? Surely.
Uber has over 93 million active users and their gross bookings for last year were a whopping $58 billion.
Customer Experience Score (CXS)
CXS metric determines the quality of user experience and directly relates to client retention.
Like NPS, the customer experience score (CXS) determines how happy customers are with your product in a given period, which helps you improve it if needed.
If this doesn’t seem that important, think again.
Here’s what PWC found when surveying customers:
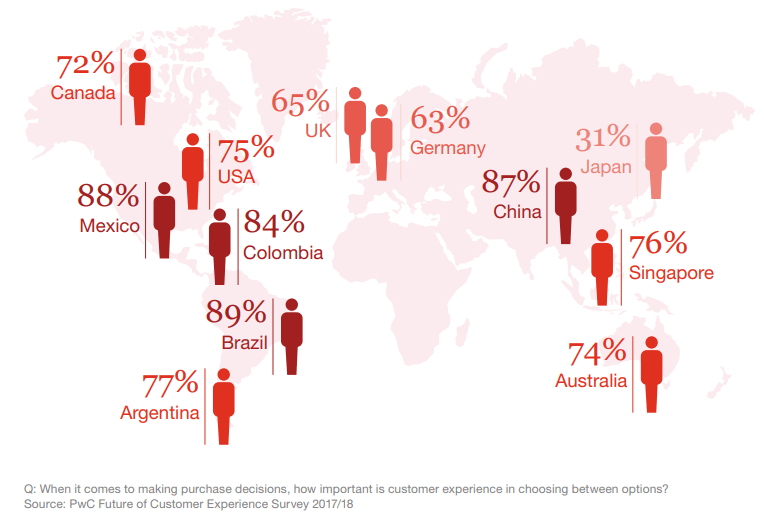
Source: pwc.com
The results state that 75% of US customers turn to the customer experience when deciding between different products or services.
What does this statistic mean for you?
It means that you’re probably getting only ¼ of the customers that you could get if you are not providing a great user experience.
Now that we’ve established just how vital CXS is to your business, here’s how to calculate it. Much like NPS, you’ll need to ask a question in a survey to estimate CXS.
You can ask the clients how satisfied they are with the product in the given period (a week, a month, a year) and then work with the data.
The customers who rate you from 8 to 10 are happy with the product, and you should strive to get as many high grades as possible.
However, pay special attention to those who rate you with a six or less because that means they’re probably dissatisfied. You can choose to reach out to such customers or keep track of their scores to notice any progress throughout the year.
In general, you should track each customer’s responses to see how well you’re doing—some customers might give you a ten the first month and then a five the other, so it’s essential to have a clear picture of the CXS score over a period of time.
If you’re suddenly getting a lot of negative feedback, it’s time to act on your customers’ feedback and do it fast before you lose them!
Customer Satisfaction (CSAT)
If you want to know whether you’re on the right track to customer retention, pay attention to your customer satisfaction (CSAT).
The higher the number of satisfied customers, the more likely you are to have a good retention ratio. But, keep in mind that customer satisfaction can be very biased and doesn’t necessarily have to reflect the quality of your product.
Generally speaking, your clients should get the chance to fill out the survey after interacting with your CS team, whether over chat, phone, email, or on the website.
Keep the survey short and ask them to rate how satisfied they are with the solution of their problem.
Clearly, the higher the score, the better your team is at solving problems and helping customers.
A low score doesn’t always mean that your team isn’t doing their job right—sometimes the customers want something that isn’t possible at the moment, but you can still use their feedback to learn and improve.
Remember: CSAT can make or break your SaaS company.
Skeptical?
We have two interesting stats for you.
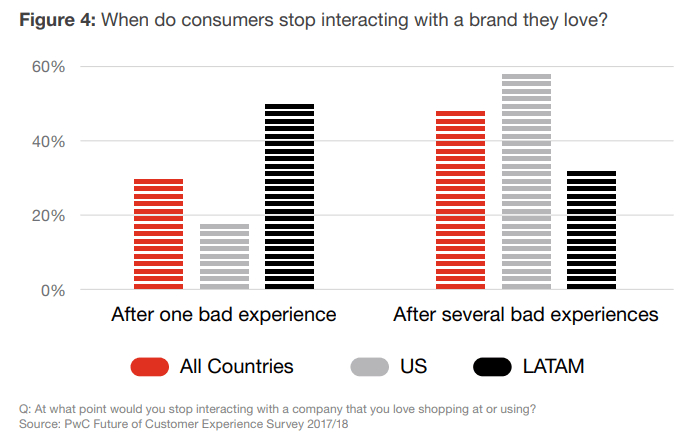
Source: pwc.com
First, nearly 20% of US customers give up on a brand they like after only one negative experience. Yes, one!
The number is even higher for all countries included (30%) and is around 50% for Latin America.
Additionally, almost 60% of US customers would give up on the brand after a couple of bad experiences.
Can you blame them?
Clearly, customers are quick to drop a company after a mistake since there is a lot of competition.
What does this have to do with CSAT, you may be wondering.
This is where the second statistic comes in: over 70% of customers are willing to stay with you after a mistake if they receive excellent customer service.
That 20% from the first statistic? 70% of them are staying because of your team’s support, no matter the mistake. Therefore, good CS can help you out if the product happens to fail you.
So, how can you improve your CSAT?
According to Snapcall.io, it’s not that hard:
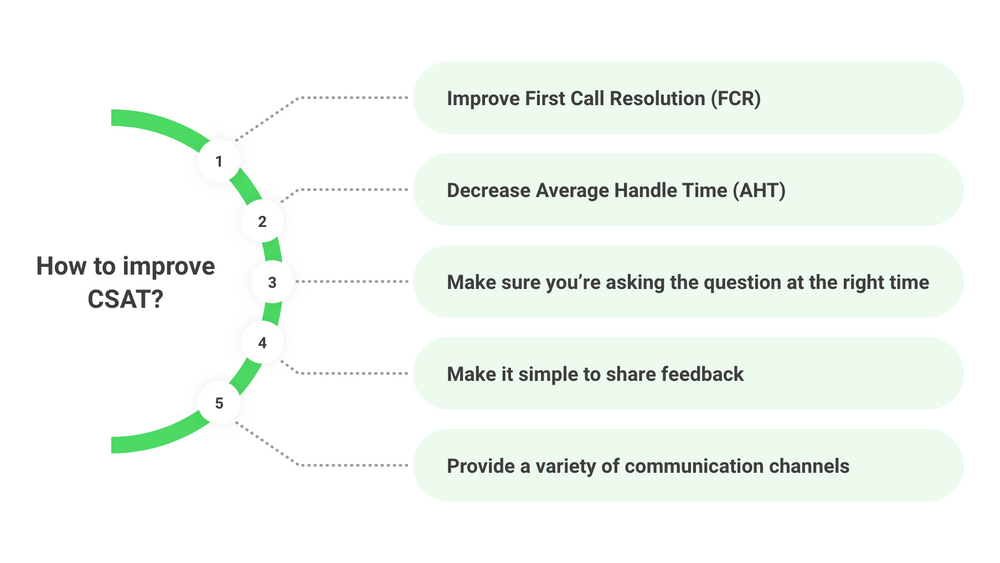
Source: blog.snapcall.io
They suggest taking care of the customer’s request as soon as possible and not making them wait longer than necessary. It makes sense—customers won’t wait around for a solution forever.
Besides, why should they? Canceling a subscription has never been so easy as it is today.
To stop your customers from doing that, you can offer them different ways of contacting you, which will positively impact your CSAT.
Some people prefer to talk over the phone, while some would like to handle it over chat. Why limit a choice for them when you can let them decide?
Then, think of how convenient it is for your clients to leave reviews. The easier it gets, the better, because you’ll get more invaluable first-hand feedback that can help you learn and grow.
An important thing to think of is the moment you send the surveys to customers.
Do you do it after they send their first email, the next day, or only after the problem has been solved?
Think of the right moment and act on it then.
A low CSAT score is a clear sign of something going wrong. Act on it fast and improve the results or watch your customers leave!
First Contact Resolution (FCR) Rate
Customer service plays a critical role in customer retention, so you have to track its efficiency!
The first contact resolution (FCR) rate metric lets you understand how successful your team is at solving issues after the first contact with the customer.
FCR explains how fast your customers’ problems are solved, which directly impacts their satisfaction.
If there are escalations to higher instances and frequent follow-ups, your FCR will not be high enough as the team cannot solve the issue right away or independently.
Calculating FCR is easy. All you have to know is the total number of calls, chats, or email tickets you’ve received and the total number of such inquiries resolved after the first contact, without the need for a follow-up.
(contacts resolved at 1st attempt / total contacts ) x 100
Keep in mind that you can replace contacts with any other type of inquiry your customer service team gets.
Suppose you’ve received 1,000 calls this month, but around 500 of them had a follow-up call. Your FCR rate for calls would be 50%, which is not the best result out.
However, the formula above doesn’t exclude the contacts that simply cannot be resolved by the first-level agents in your CS.
Since there are cases when the customer has a complaint that has to be forwarded to the manager or the IT experts, you might want to distinguish between the two. In that case, use the net FCR formula.
[contacts resolved at 1st attempt / total contacts - contacts unresolvable at 1st attempt ] x 100
Using the example above, let’s say that 250 contacts were unresolvable by the first-level agents. Therefore, your FCR rate would go up to 75%, which is above the standard of 71%.
If you’re trying to increase your FCR rate, try to get to the root cause of the issue and determine why the agents weren’t able to solve the case during the first contact.
The answer might point to disorganization, a problem with the product itself, or insufficient knowledge.
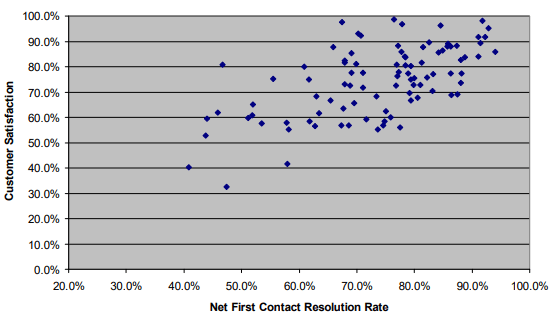
Bear in mind that FCR directly correlates with customer satisfaction, as shown in the graph below:
Source: hopeprojectdc.org
The higher your FCR, the higher your CSAT, and it’s no surprise. The faster you can solve their problems, the happier your customers will be.
Since we already know how important CSAT is for SaaS businesses, keep an eye on FCR too. In case of low scores, do everything you can to improve your results. If you don’t, you’re letting FCR impact your CSAT and your company’s health.
Conclusion
A good customer retention rate helps your SaaS business grow further and attract new customers, which is why you should focus on improving it.
Do this by using and understanding the metrics from this article. They will help you determine what aspects of your business can be improved, whether it’s customer service, the product itself, or something else.
But, remember: customer satisfaction is key.
Customers who aren’t satisfied with your product or service don’t have to stay—they can always opt for a competitor.
If you want to prevent that, invest in tracking and improving customer retention. Can you really afford not to?


