
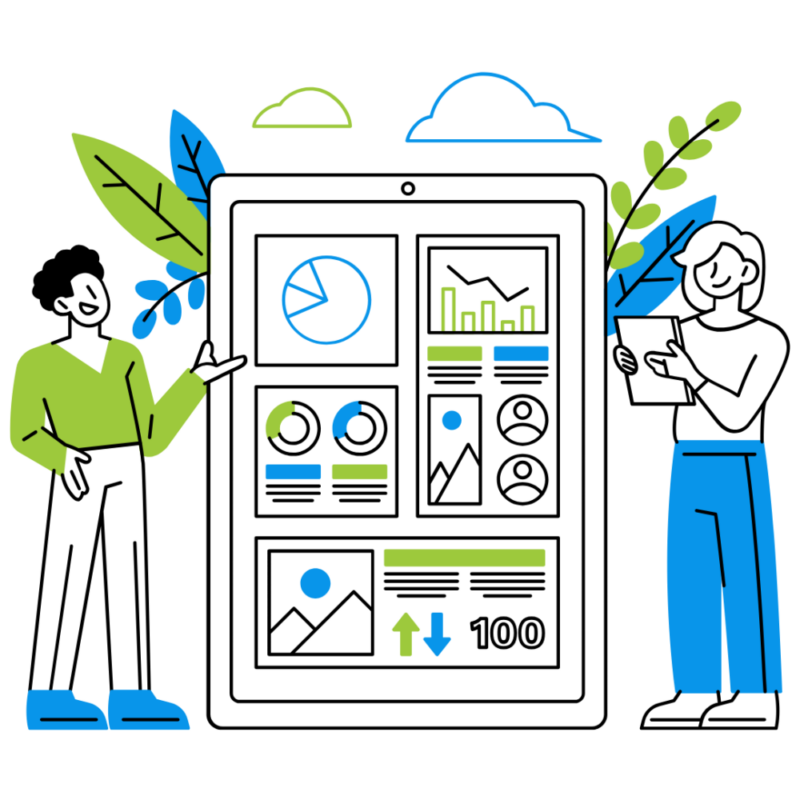
Visual Data at Your Fingertips
Turn raw data into clear, easy-to-read graphs that show exactly what you need to know.
Custom Graphs
Generate visual breakdowns for any data set, broad or specific.
Filter-Friendly
Run stats on your custom filters for deeper insights.
Clear Comparisons
See demographics, sources, and trends at a glance.

Insights That Boost Conversions
Track and analyze applicant behavior to improve the registration process and increase completions.
User Tracking
See where applicants succeed or drop off.
Actionable Feedback
Learn what’s working and what’s not, without endless surveys.
Quick Fixes
Resolve issues in just a few clicks to improve completion rates.
Powerful Statistical Engine
Summarize and visualize complex data so you can focus on decisions, not spreadsheets.
Concise Summaries
Turn thousands of lines of data into clear, digestible visuals.
Department Ready
Give every team the insights they need to act quickly.
Any Metric You Need
From payment status to service extensions, it’s all trackable.

Smarter Decisions, Faster
Leverage your data to make informed, strategic moves across your organization.
Better Planning
Understand trends to guide future projects.
Marketing Insights
See exactly where applicants are coming from.
Operational Efficiency
Use accurate data to streamline workflows.